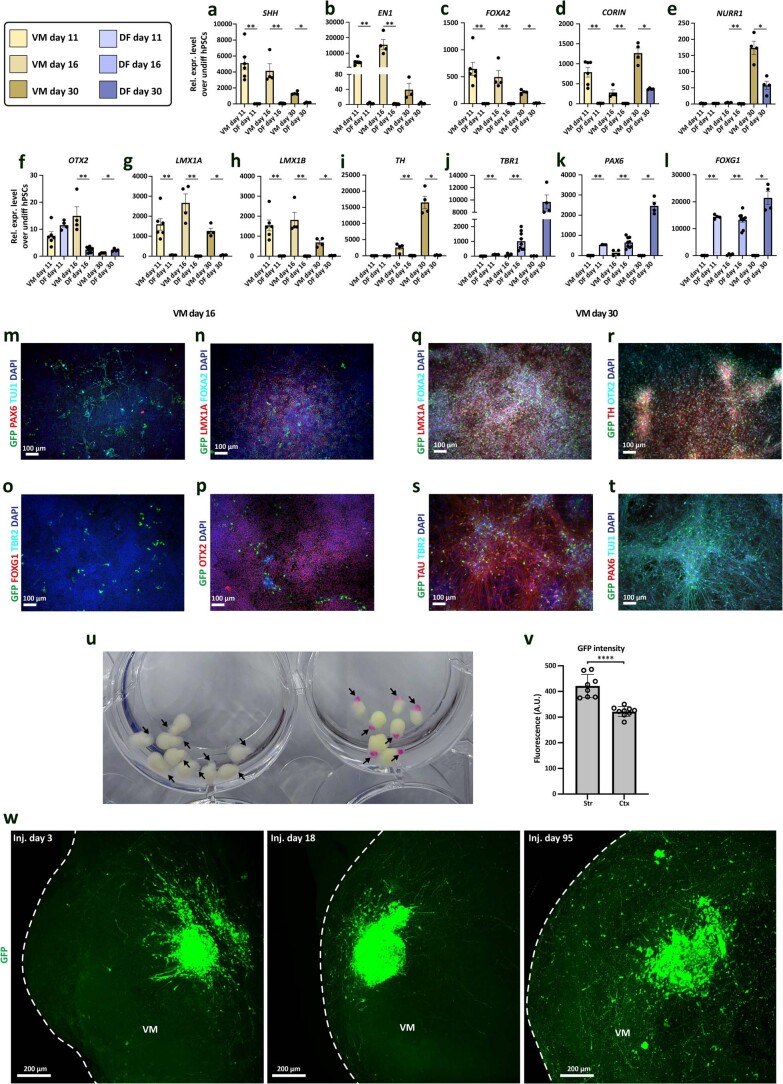
Extended Data Fig. 9. Quality control for VM progenitors for grafting.
a-e, Quality control for mDA neuronal differentiation as for dopaminergic cell therapy. mDA differentiation expressed the mDA progenitor markers SHH, EN1, FOXA2, CORIN and NURR1. mDA differentiation in brown, dorsal forebrain (DF) comparison in blue. f-i, the mDA markers OTX2, LMX1A, LMX1B and TH were highly expressed in VM in comparison to DF. j-l, The dorsal forebrain markers TBR1, PAX6 and FOXG1 were absent in the mDA differentiation. a-l, Significance was calculated using a two-sided Mann–Whitney test (n = 4-9 individual wells of one differentiation). Data shown as mean ± SEM. p values: a, 0.0095|0.0028|0.0286, b, 0.0095|0.0028, c, 0.0095|0.0028|0.0286, d, 0.0095|0.002|0.0286, e, 0.0028|0.0286, f, 0.0028|0.0286, g, 0.0095|0.0028|0.286, h, 0.0095|0.0028|0.0286, i, 0.0028|0.286, j, 0.0095|0.0028, k, 0.0095|0.0028|0.0286, l, 0.0095|0.0028|0.0286. m-p, Immunofluorescent staining of mDA differentiation on day 16 with mDA markers (LMX1A, FOXA2, OTX2), forebrain markers (PAX6, FOXG1 and TBR2) and the neuronal marker TUJ1. q-t, Immunofluorescent labeling of mDA differentiation on day 30 with mDA neuronal markers (LMX1A, FOXA2, OTX2, TH), forebrain markers (PAX6 and TBR2) and the neuronal marker TUJ1 and TAU. u, Image of day 120 MISCOs in 6 well plates. Stereotypic morphologies in WT MISCOs (left) allow the identification of the VM tissue (black arrows), which was additionally tested by MISCO fusions containing CAG-tdTomato expression in the VM organoid derived tissue (black arrows). v, Quantification of GFP fluorescence in striatal and cortical tissue 95 days after injection. Statistical significance was calculated using an unpaired two-sided t-test. P < 0.0001. n = 8|9 regions of one differentiation/injection batch. Data shown as mean ± SD. w, Between day 3 and day 95 after injection in 60-day-old MISCOs, mDA grafts mature and innervation increases (representative images of 3D IHC and 2Eci tissue-cleared MISCOs, similar results in n = 4-5 organoids per timepoint).

