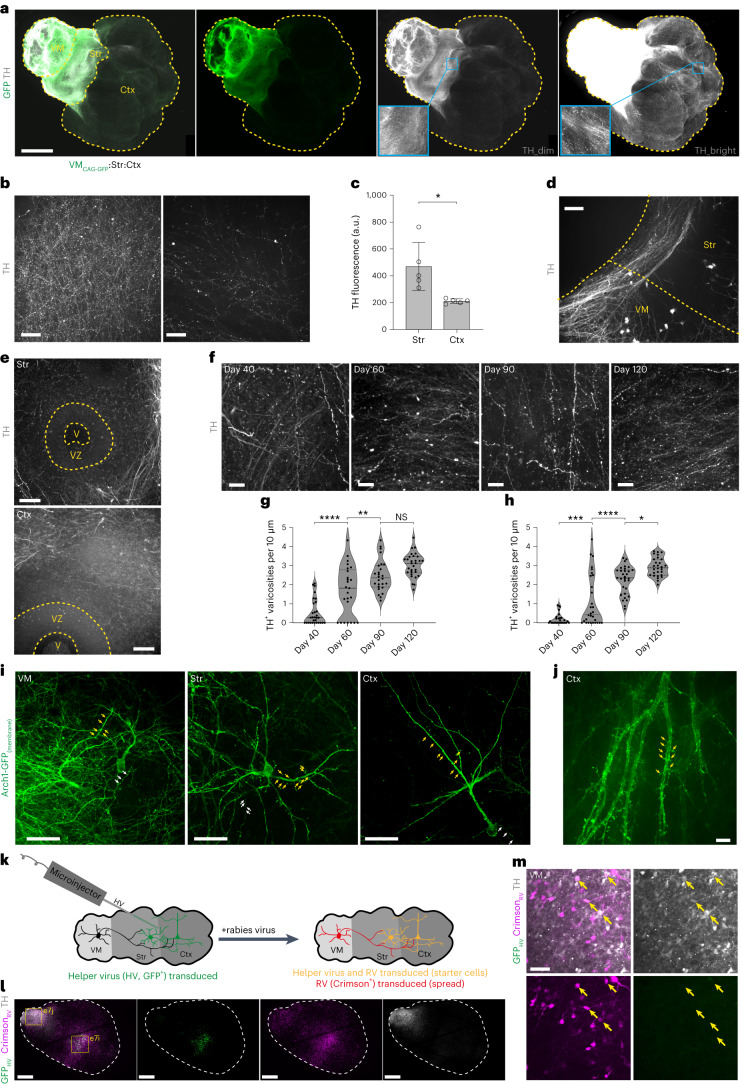
Fig. 3. MISCOs form structural features of maturation.
a, 2Eci-cleared 60-day-old MISCOs with CAG-GFP expression in the VM tissue and immunolabeling for TH in gray (representative images; similar results in n = 7 of 7 organoids). b, Striatal tissue (left) had stronger innervation than cortical tissue (right). c, Quantification of peak fluorescence of 2Eci-cleared organoid recordings in striatal and cortical tissue (n = 5 organoids, *P = 0.0125, unpaired two-sided t-test). d, Dopaminergic (TH+) axons form axon bundles that project into the forebrain tissue. e, TH-positive axons generally avoid neurogenic regions (representative images; similar results in n = 17 of 17 rosettes of 8 organoids with ≤1 TH+ axon per neural rosette). V, ventricle; VZ, ventricular zone. f–h, TH-positive axons in the striatum (f) and cortex (not shown) structurally mature over time, as indicated by an increase in varicosities of TH-positive axons between day 40 and 120 in the striatum (g) and cortex (h) (n = 5–7 organoids per timepoint). Statistical significance was tested using one-way ANOVA followed by Tukey’s multiple comparison test (****Padj < 0.0001, **Padj = 0.0086, NS (not signficant), Padj = 0.0877 (g), ***Padj = 0.0002, ****Padj < 0.0001, *Padj = 0.0109 (h)). i,j, Organoids transduced with an AAV expressing Syn-Arch1-GFP, a membrane-bound variant of GFP, enable observation of dendrites (yellow arrows, magnified view: Extended Data Fig. 7f–h) and axonal boutons (white arrows, magnified view: Extended Data Fig. 7f–h). Stereotypic morphologies of pyramidal neurons in cortical tissues (j, magnified view of a dendritic tree) and neurons resembling stereotypic multipolar morphology in the striatal tissue as well as heterogeneous morphologies in VM organoids were found (representative images; similar results in n = 12–20 neurons per region of 150-day-old organoids). k, Schematic diagram of monosynaptic rabies virus (RV) tracing for retrograde tracing of VM axons. Region-restricted helper virus (HV) transduction was achieved by injection of small volumes into the forebrain tissue. l, TVA-G helper virus (GFP+) transduction was locally constrained into the forebrain. Rabies virus signal (Crimson+) was predominantly found surrounding the injection site, but also in the periphery of the organoids (representative images; similar results in n = 5 of 5 organoids). Magnified views (yellow boxes) are given in Extended Data Fig. 7i (e7i) and 7j (e7j). m, In the VM, rabies virus broadly labeled neurons, among others dopaminergic (TH+) neurons (yellow arrows) (representative images; similar results in n = 5 of 5 organoids). Data given as mean ± s.d. Scale bars: a, 1 mm; l, 500 µm; d, 100 µm; b,e,i,m, 50 µm; f, 20 µm; j, 10 µm.

