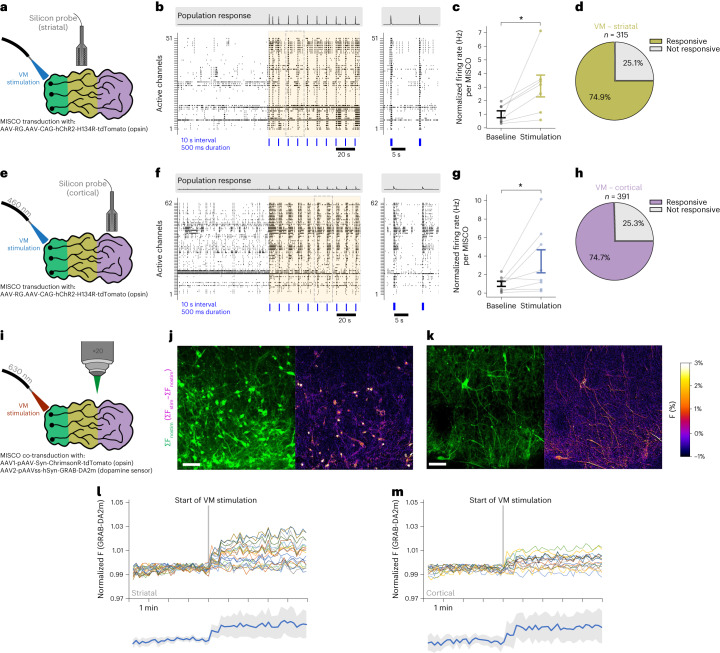
Fig. 4. MISCOs show neuronal activity and functional dopaminergic connectivity.
a,e, Schematic diagram of the optogenetic stimulation of VM with simultaneous extracellular recordings in striatal (a) and cortical (e) tissue. 140–171-day-old MISCOs were transduced with AAV-RG.AAV-CAG-hChR2-H134R-tdTomato and stimulated with 460 nm light focused on VM tissue using an optical fiber. b, Representative active channel raster plots in striatal tissue ±100 s from the initiation of optogenetic stimulation (orange box) with a 20 s recording interval (right). The 460 nm LED light pulses were 500 ms in duration and occurred every 10 s (blue lines). c, Normalized firing rate (Hz) changes in striatal tissue across 10 min baseline and 10 min optogenetic stimulation periods, calculated per MISCO across active channels (n = 7 independent experiments across two organoid batches, a total of 315 active channels, two-sided Wilcoxon signed-rank test, *P = 0.016). d, Percentage of active electrodes from extracellular recordings in striatal tissue responsive to VM optogenetic stimulation (235 of 315 active responding channels from 7 independent experiments across two organoid batches). f, Representative active channel raster plots in cortical tissue ±100 s from the initiation of optogenetic stimulation (orange box). g, Normalized firing rate (Hz) changes in cortical tissue across 10 min baseline and 10 min optogenetic stimulation periods, calculated per organoid from active channels (8 independent experiments across three organoid batches, a total of 391 active channels, two-sided Wilcoxon signed-rank test, *P = 0.039). c,g, Data given as mean ± s.e.m. h, Percentage of active electrodes in cortical tissue responsive to VM optogenetic stimulation (292 of 391 active responding channels from 8 independent experiments across three organoid batches). i, Schematic diagram of optogenetic stimulation of VM tissue and simultaneous fluorescent confocal recording of striatal and cortical tissue. MISCOs were transduced with AAVs containing the optogenetic construct ChrimsonR and the fluorescent genetic encoded dopamine sensor GRAB-DA2m. j,k, Recordings of striatal (j) and cortical (k) tissue in 130-day-old MISCOs show increased fluorescence (F) of GRAB-DA4.4 upon VM stimulation. l,m, Timelapse recording of striatal (l) and cortical (m) regions in MISCOs showing an increase of dopamine release upon stimulation of VM tissue. Bottom: Individual neural GRAB-DA4.4 intensity of both striatal and cortical tissues (mean in blue with s.d. in gray; n = 3 of 3 recordings of one batch). Scale bars: j,k, 50 µm.

