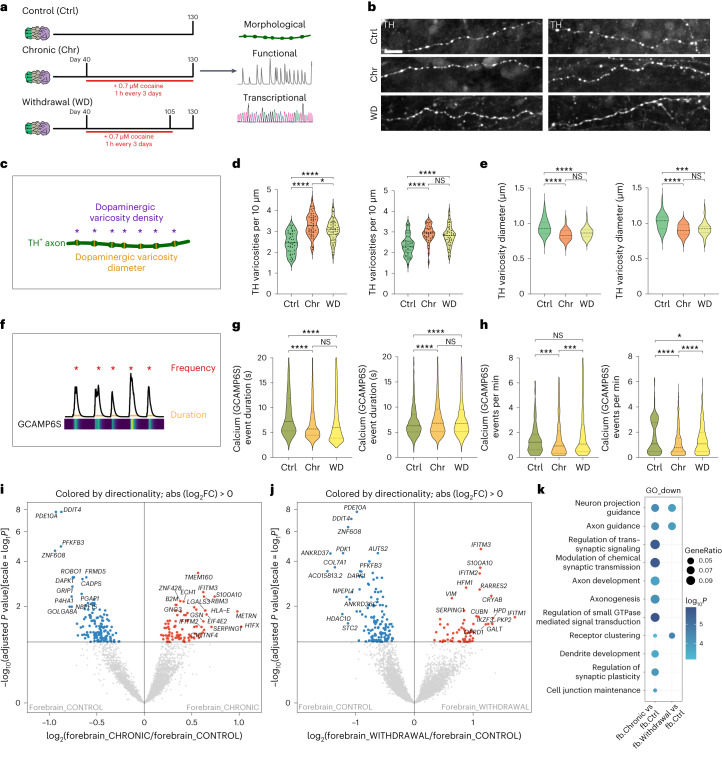
Fig. 6. Cocaine treatment of MISCOs enables the study of perturbations of the dopaminergic system in vitro.
a, Schematic diagram of the treatment of MISCOs with cocaine. Organoids were treated with 0.7 µM cocaine hydrochloride for 1 h every 3 days from day 40 until day 130 (chronic condition) and until day 105 (withdrawal condition). Functional, morphological and transcriptional analysis was performed on day 130. b, TH- immunolabeled dopaminergic axons in striatal (left) and cortical tissue (right) in control, chronic and withdrawal MISCOs (representative images; similar results in n = 6–8 organoids per condition, 39–49 axons). c, Schematic diagram of the varicosity density and varicosity diameter parameters in dopaminergic axons. d, Quantification of TH-positive varicosity density in striatal (left) and cortical (right) tissue (n = 6–8 organoids per condition, 39–49 axons). ****Padj < 0.0001, *Padj = 0.0323 (Str), NS, Padj = 0.5420 (Ctx). e, Measurement of varicosity diameter (as mean of all boutons per axon) in striatal (left) and cortical (right) tissue (n = 6–8 organoids, 36–47 axons per condition and 1,055, 1,552, 1,347 (striatal) and 923, 1,063, 1,340 (cortical) boutons measured). ****Padj < 0.0001, ***Padj = 0.0002, NS, Padj= 0.2078 (Str) and Padj = 0.7079 (Ctx). f, Schematic diagram of the parameters frequency and duration from GCAMP traces after extraction with CaImAn. g,h, MISCOs with GCAMP6S expression in either VM, striatal or cortical tissue were recorded on day 130 in control, chronic and withdrawal conditions (10–21 organoids per condition). g, Analysis of calcium event duration showed a significant decrease in striatal (left) and an increase in cortical (right) neuron calcium event duration (striatal: 1,776, 2,144, 4,254 individual calcium events; cortical: 1,437, 6,931, 8,000 individual calcium events). ****Padj < 0.0001. NS, Padj = 0.7303 (Str) and Padj = 0.9653 (Ctx). h, Analysis of calcium event frequency for striatal neurons (left) (n = 248, 245, 680 events) and cortical neurons (right) (n = 175, 936, 885 events) in control, chronic and withdrawal conditions. ***Padj = 0.0009, ***Padj = 0.0002, NS, Padj = 0.9434 (Str). ****Padj < 0.0001 *Padj = 0.0300 (Ctx). Data given as mean ± s.d. Samples were analyzed with one-way ANOVA followed by Tukey’s multiple comparison test. i,j, Volcano plot comparing bulk RNA-seq data of day 130 forebrain organoids for chronic versus control (i) and withdrawal versus control (j) (n = 6–9 organoids of 2–3 batches). FC, fold change. k, GO term overrepresentation analysis of genes downregulated in forebrain (fb) chronic and withdrawal conditions versus forebrain control. Data given as mean ± s.d. Scale bar: b, 10 µm.

