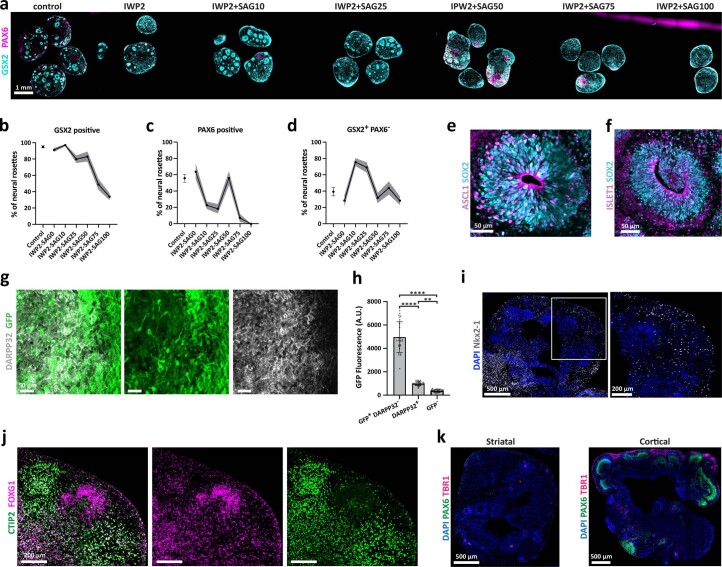
Extended Data Fig. 2. Low levels of SHH activation and Wnt inhibition are sufficient to induce LGE neuroepithelium and striatal neurogenesis.
a, Dose–response curve of SAG (0-100 nM) to enrich for GSX2+ LGE neuroepithelium in day 27 old organoids (representative batch, similar results in n = 10-15 organoids per condition of 3 independent batches). b-d, Quantification of GSX2+ (b) and PAX6+ (c), as well as GSX2+ & PAX6− neural rosettes after SAG dose curve in 27-day-old organoids. n = 10-15 organoids per condition of 3 independent batches. Gray areas visualize ±SEM. e, IWP-2−SAG10nM treated organoids display ASCL1 positive neural progenitors (SOX2+) (representative image, similar results in n = 4/4 organoids). f, IWP-2-SAG10nM treated organoids produce ISLET1 positive neurons (representative image, similar results in n = 4/4 organoids). g,h, DARPP32+ clusters express the subpallial marker DLX5 in a DLXi5/6-GFP reporter line, but at lower levels than interneurons (DLXi5/6-GFP+, DARPP32−) on day 80 (representative image, similar results in n = 6/6 organoids). Statistical analysis was done with a one-way ANOVA followed by Tukey’s multiple comparisons test. Padj = <0.0001|0.0017|< 0.0001. Data show mean ± SD. i, Striatal patterned organoids on day 60 display NKX2-1+ interneurons scattered through the organoid (representative image, similar results in n = 5/5 organoids). j, Striatal organoids are positive for FOXG1 and CTIP2 (representative image, similar results in n = 5/5 organoids). k, Striatal organoids do not have PAX6+ regions and are negative for the cortical neuron marker TBR1, unlike cortical organoids (representative image, similar results in 39 of 41 organoids of 6 different cell lines).

