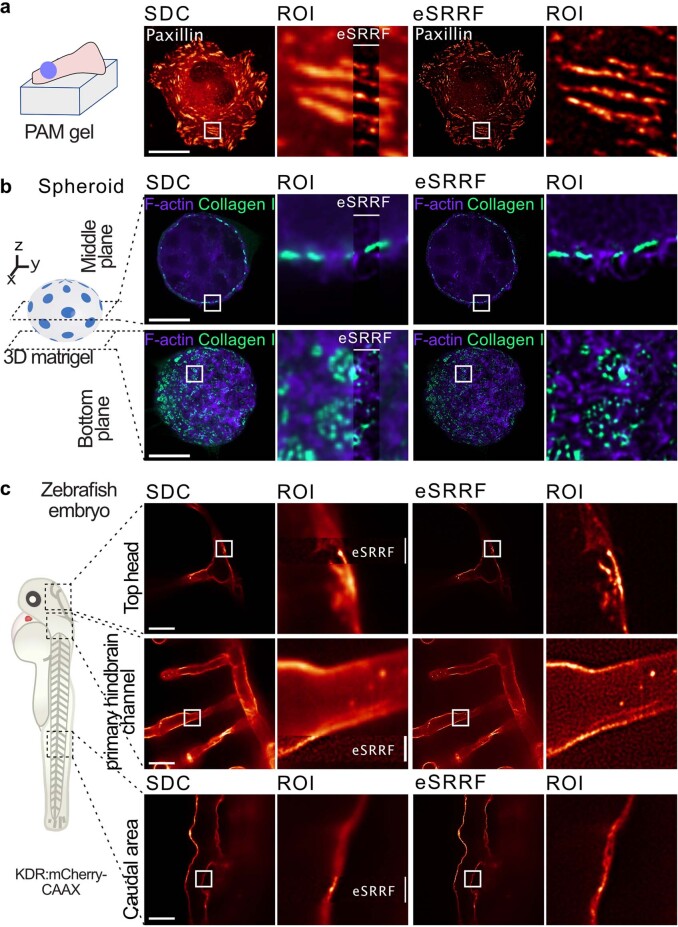
Extended Data Fig. 8. eSRRF enhances spinning-disk confocal imaging deep inside fixed and live cells, spheroid and organisms.
a U2OS cells expressing endogenously tagged paxillin were plated on 9.6 kPa polyacrylamide (PAM) gels and were imaged live using a spinning-disk confocal (SDC, resolution estimate: FRC = 573.0 ± 7.2 nm) and processed with eSRRF (resolution estimate: FRC = 197 ± 34 nm). b DCIS.com lifeact-RFP cells forming a spheroid in 3D matrigel in the presence of fluorescently labeled collagen I. Samples were fixed and imaged using a spinning-disk confocal microscope (resolution estimate: FRC(Actin)= 569 ± 59 nm/FRC(Collagen I) = 583 ± 14 nm) and processed using eSRRF (resolution estimate: FRC(Actin)= 229 ± 97 nm/FRC(Collagen I) = 130 ± 36 nm). Representative fields of view highlighting the spheroids’ middle and bottom planes are displayed. c Zebrafish embryos expressing mcherryCAAX in the endothelium were imaged live using a spinning-disk confocal. Vessels located at different parts of the embryo were imaged. For all panels, the eSRRF reconstructed images (resolution estimate: FRC(top) = 194 ± 37 nm/FRC(middle) = 393 ± 23 nm/FRC(bottom)= 307 ± 60 nm) and the original spinning disk images are displayed (resolution estimate: FRC(top) = 641 ± 82 nm/FRC(middle)= 573.9 ± 5.7 nm/FRC(bottom)= 575.9 ± 7.9 nm). The ROI zoom-ins are marked by white squares and the line profile position is marked in the eSRRF zoom-in by a white line. Intensity profiles of the diffraction-limited SDC data (dashed line) and eSRRF reconstruction are plotted in the panel on the very right. Scale bars 25 μm.

