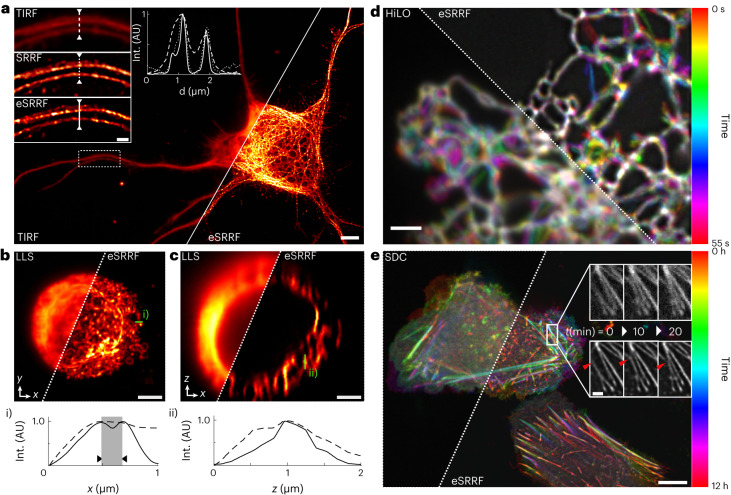
Fig. 3. Applications of eSRRF to a range of imaging modalities.
a, TIRF imaging of the microtubule network in a cultured neuron expressing Skylan-NS-tagged tubulin and subsequent eSRRF processing (see insets and line profile; TIRF-FRC, 425 ± 42 nm; SRRF-FRC, 213 ± 41 nm; eSRRF-FRC, 193 ± 51 nm). b,c, LLS imaging of the ER in Jurkat cells. xy projection (b) and xz projection using LLS microscopy (c) (top left) and the combination with eSRRF reconstruction (bottom right). As the acquisition is sequential, the eSRRF processing was applied on a slice-by-slice basis. Line profiles corresponding to the x and z direction are shown in i and ii, respectively. Sub-diffraction features separated by 190 nm in the lateral plane are marked in gray (FRC resolution LLS/eSRRF, 164 ± 9/84 ± 43 nm). AU, arbitrary units. d, Live-cell HiLO-TIRF of COS-7 cells expressing PrSS-mEmerald-KDEL marking the ER lumen imaged at a temporal sampling rate of 10 Hz (temporal color-coding, FRC resolution HiLO/eSRRF, 254 ± 11/143 ± 56 nm). e, Live-cell SDC imaging of U2OS cells transiently expressing SkylanS–β-actin imaged over a time course of 12 h by acquiring substacks of 50 frames to generate a super-resolved eSRRF reconstruction at 10-min intervals (FRC resolution est. SDC/eSRRF, 484 ± 53 nm/151 ± 77 nm). Insets of three consecutive time points (top, SDC; bottom, eSRRF) show an example of actin bundles connecting and detaching (red arrow indicator) in the rectangular region marked by the white frame. Scale bars, 5 µm (a), 1 µm (a insets), 3 µm (b,c), 2 µm (d), 10 µm (e) and 2 µm (e insets). FRC shown as mean ± s.d.

