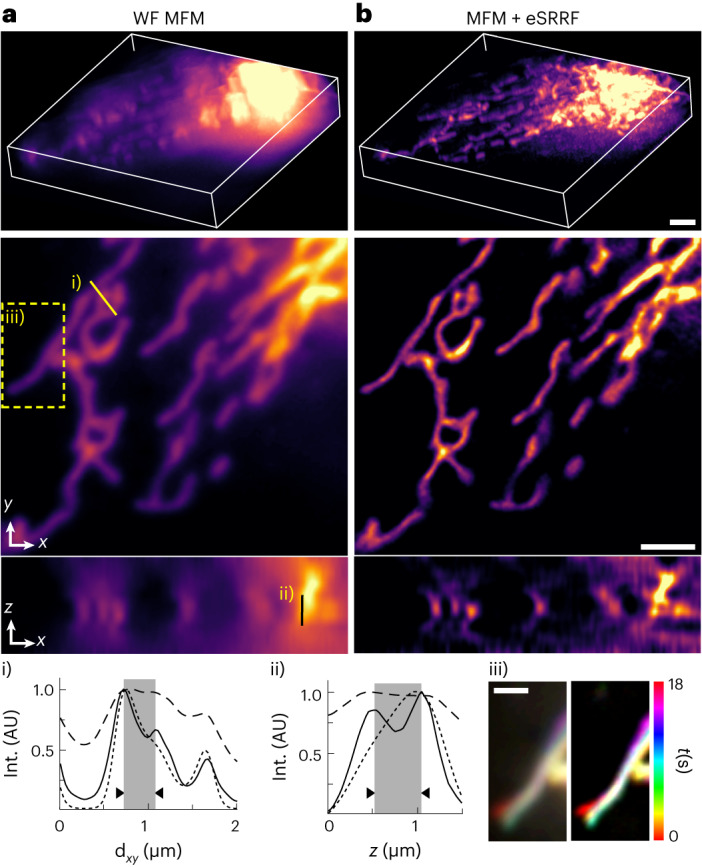
Fig. 4. eSRRF and MFM allows 3D live-cell super-resolution.

a, Live-cell volumetric imaging in MFM WF configuration of U2OS cells expressing TOM20-Halo, loaded with JF549. b, 3D eSRRF processing of the dataset creates a super-resolved volumetric view of 20 × 20 × 3.6 μm3 at a rate of ~1 Hz (MFM + eSRRF). The 3D rendering (top); single cropped z-slice (FRC resolution in xy, interpolated, 231 ± 10 nm; eSRRF, 74 ± 12 nm) (middle); single cropped y-slice (FRC resolution in xz eSRRF, 173 ± 19 nm) (bottom). (i) and (ii) mark the positions of the respective line profiles in the xy and z-plane in the MFM (dashed line), deconvolved MFM (dotted line; Extended Data Fig. 10) and MFM + eSRRF (solid line) images (a,b). The distance of the structures resolved by eSRRF processing (marked gray) is 360 nm in the lateral directions (x,y) and 500 nm in the axial direction (z). (iii) marks the displayed area of the temporal color-coded projection of a single z-slice over the whole MFM (left) and MFM + eSRRF (right) acquisition. Scale bars, 2 µm (a,b) and 1 µm (iii). FRC shown as mean ± s.d.
