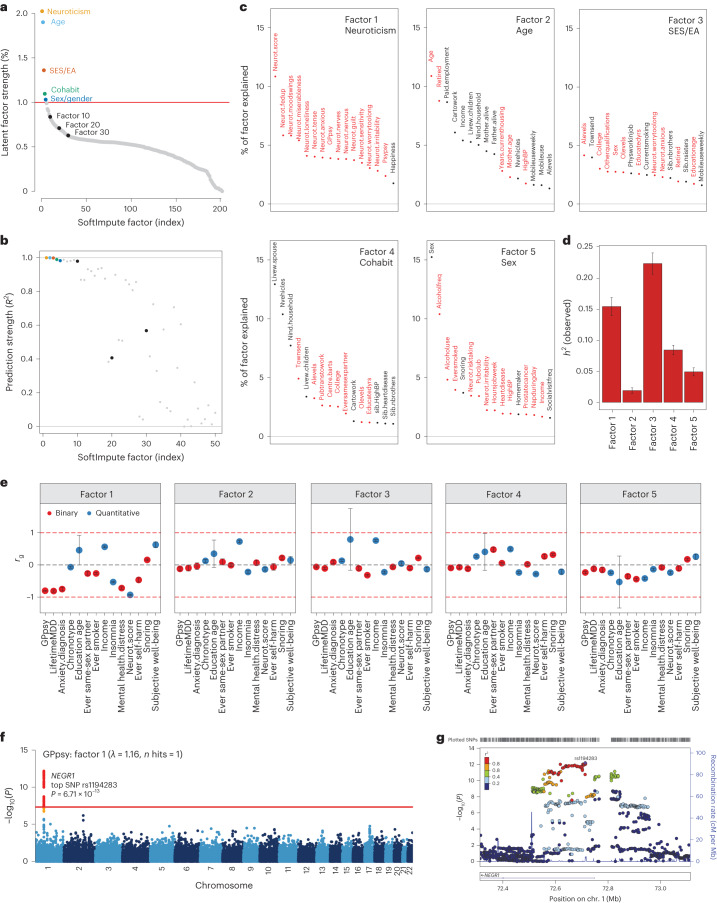
Fig. 3. Characterizing top latent factors driving SoftImpute.
a,b, Statistical importance of each factor measured by percentage variance explained in the phenotype matrix (a) and factor prediction strength (b). c, Top phenotype loadings for the top five SoftImpute factors. d,e, Estimates of heritability (d) (n = 337,126 for all factors) and genetic correlation (e) of the top five SoftImpute factors with MDD-relevant traits (n values for all MDD-relevant traits can be found in Supplementary Table 1). f, Logistic regression GWAS Manhattan plot of GPpsy conditioning on SoftImpute factor 1; the red line shows the genome-wide significance threshold. g, LocusZoom plot of the significant GWAS locus in gene NEGR1. All error bars indicate 95% CI.

