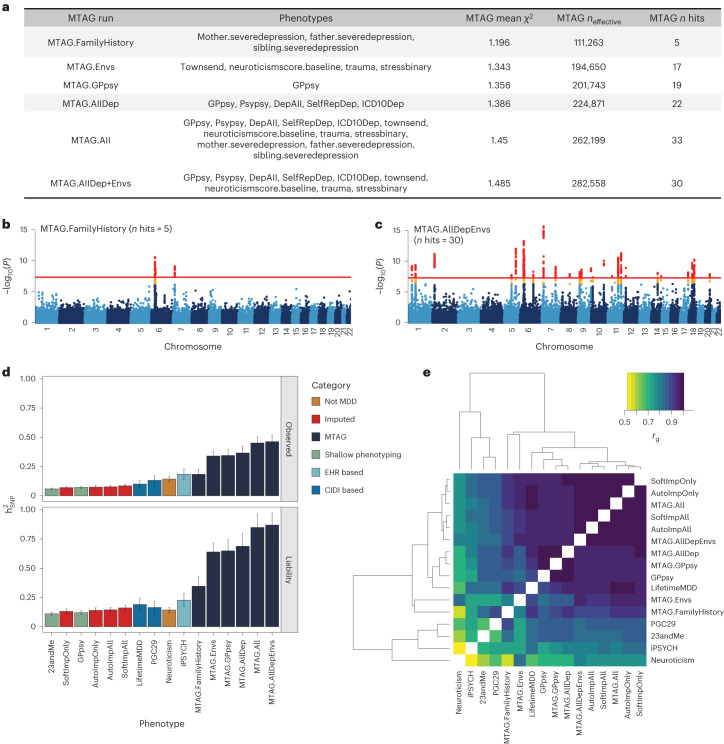
Fig. 4. MTAG results for different choices of input phenotypes.
a, Description of the evaluated input choices for MTAG and their resulting GWAS summary statistics. The MTAG effective sample size refers to the power-equivalent sample size of the MTAG GWAS versus the single-trait GWAS19, calculated as neffect = nsingle ⨯ (χ2MTAG − 1)/(χ2single − 1), where the χ2 terms are the average GWAS chi-squared values. b,c, Manhattan plots for the MTAG models with the fewest (MTAG.FamilyHistory) (b) and most (MTAG.AllDep+Envs) (c) GWAS hits. −log10(P) values shown on the y axis were before adjustment for multiple testing; red lines show the genome-wide significance threshold of P < 5 × 10⁻⁸. d, SNP-based heritability estimates on the observed and liability scales for observed, imputed, and MTAG GWASs on LifetimeMDD as well as reference phenotypes (neffect is shown in Supplementary Table 5). e, Estimated genetic correlations for observed, imputed and MTAG analyses of LifetimeMDD and reference phenotypes. All error bars indicate 95% CI.

