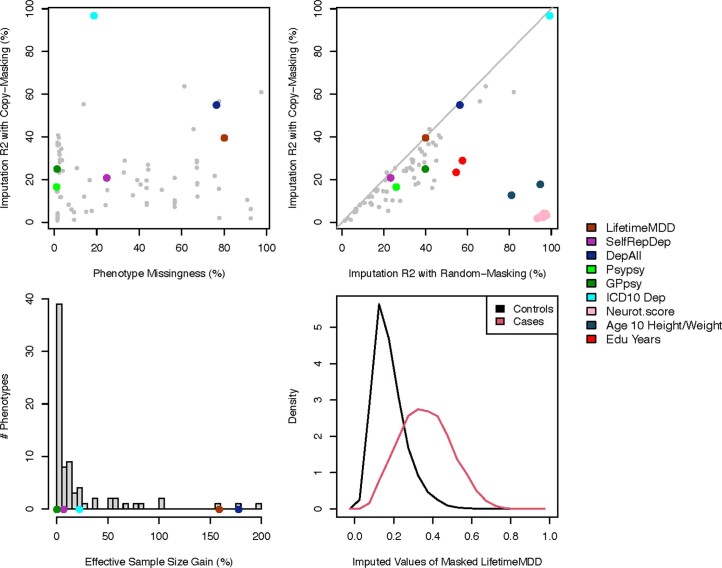
Extended Data Fig. 1. Imputation accuracy metrics across our depression-relevant UKB phenome.
a, Scatter plot of estimated imputation accuracy against phenotype missingness. b, Scatter plot of estimated imputation accuracy using our copy-masking approach against naive estimates masking entries uniformly at random. c, Distribution across phenotypes of gained effective sample size from phenotype imputation. d, Distribution of imputed LifetimeMDD values for held-out observations, which informally reflect the probabilities of having LifetimeMDD.

