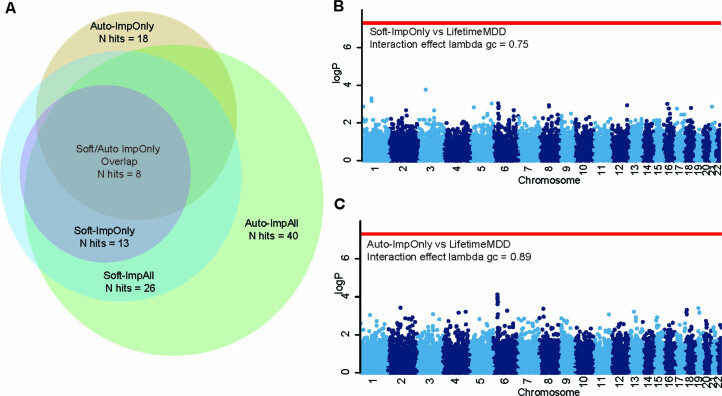
Extended Data Fig. 2. Quality control on GWAS loci identified from imputed LifetimeMDD.
a, Venn diagram showing the overlap of GWAS loci identified from GWAS on ImpOnly and ImpAll measures of LifetimeMDD from Softimpute and Autocomplete. b,c, Manhattan plots of Cochran′s Q statistic’s P-value for heterogeneity, obtained through a random effect meta-analysis performed with METASOFT, between genetic effects identified from GWAS on observed LifetimeMDD and GWAS on ImpOnly measures of LifetimeMDD; −log10(P) values shown on the y-axis were before adjustment of multiple-testing; red line shows the genome-wide significance threshold corresponding to P = 5 × 10⁻⁸.

