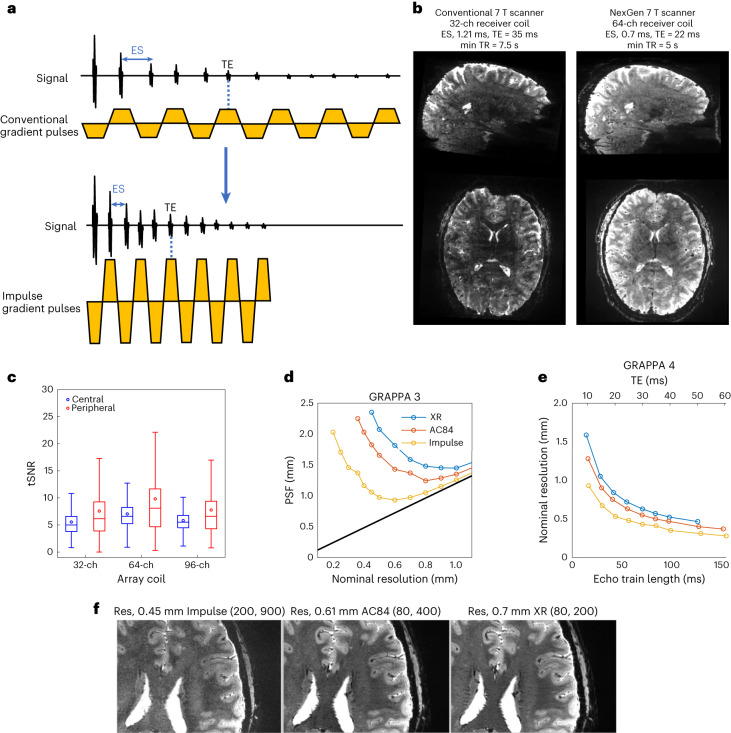
Fig. 3. EPI on the NexGen 7 T.
a, EPI pulse sequence diagram shows readout gradient pulses with conventional versus higher amplitude and faster SR that reduces ES. b, Comparison of EPI image quality at 0.6 mm isotropic resolution covering the brain on the conventional 7 T scanner (MAGNETOM 7 T Plus) and the NexGen 7 T scanner with the Impulse head gradient coil using the same acquisition parameters: GRAPPA × SMS = 4 × 3, partial Fourier 6/8, 216 slices, matrix size 320 × 320. The left shows the conventional 7 T (80 mT m−1, 200 T m−1 s−1, 32-ch Rx, 8-ch Tx). The right shows the NexGen 7 T (200 mT m−1, 900 T m−1 s−1, 64-ch Rx, 8-ch Tx coil). c, Box plot of temporal SNR within a central and peripheral ROI (n = 3,333,301 and 3,980,755 voxels, respectively). Boxes show median, 25th and 75th percentile values. Circles show mean values. Whiskers show 1.5 times the interquartile range. d, PSF on EPI image phase-encoded axis due to T2* decay for a given resolution achievable at three different gradient coil performances using GRAPPA acceleration of 3. e, Achievable nominal resolution at a given TE with same echo train duration with the same T2* signal decay for three different gradient coil performances using GRAPPA acceleration of 4 and 6/8 partial Fourier. f, EPI images, at maximum achievable resolution (Res) at TE 26 ms for three different gradient coils. The highest achievable isotropic volumetric resolutions are 0.09 μl (0.45 mm isotropic voxel), 0.23 μl (0.61 mm isotropic) and 0.343 μl (0.7 mm isotropic). Differences in Gmax and SR are noted (mT m−1, T m−1 s−1) for different gradient coils.

