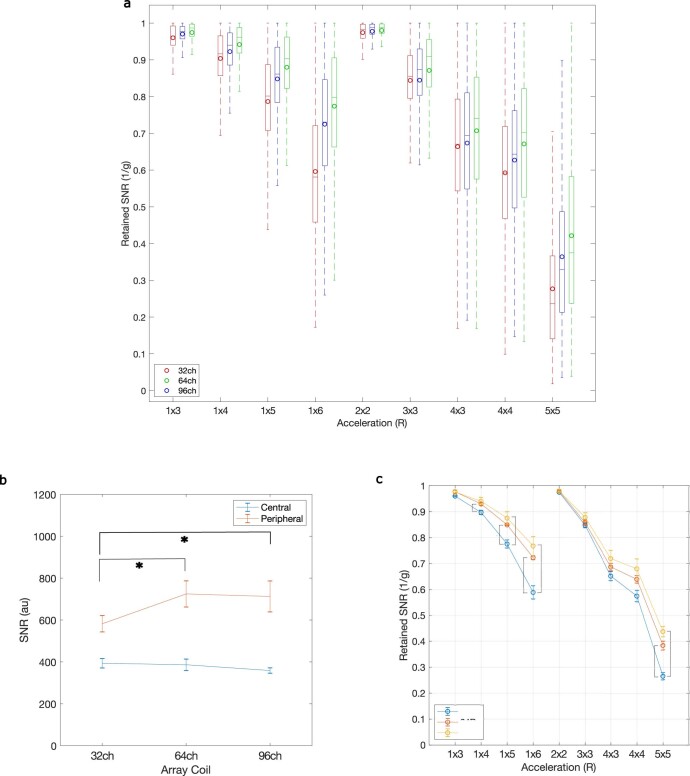
Extended Data Fig. 2. RF Array Coil Performance.
A) Histogram of retained SNR (1/G) for different accelerations for 3 arrays coils (32 ch, 64ch, 96ch). Boxes show median, 25th and 75th percentile values (n = 219233 voxels across a whole brain ROI). Circles show mean values. Whiskers show 1.5 times the interquartile range. B) Across 3 subjects, the 64Rx (paired sample t-test, p = .0144) and 96Rx (paired sample t-test, p = .0272) showed significantly higher SNR in the periphery of the brain when compared to the 32Rx. The central ROI did now show higher SNR for higher channel count arrays. Data are presented as mean values +/- standard deviation (SD). C) Across 3 subjects, the 64Rx showed higher retained SNR (1/g) than the 32Rx at accelerations of 1×4, 1×5, 1×6 and 5×5 (paired sample t-tests, p = .0433,.0114,.0085,.0067, Bonferroni corrected). The 96Rx showed higher retained SNR (1/g) than the 32Rx at accelerations of 1×5, 1×6 and 5×5 (paired sample t-test, p = .0371,.0202,.0022, Bonferroni corrected). Data are presented as mean values +/- SD.

