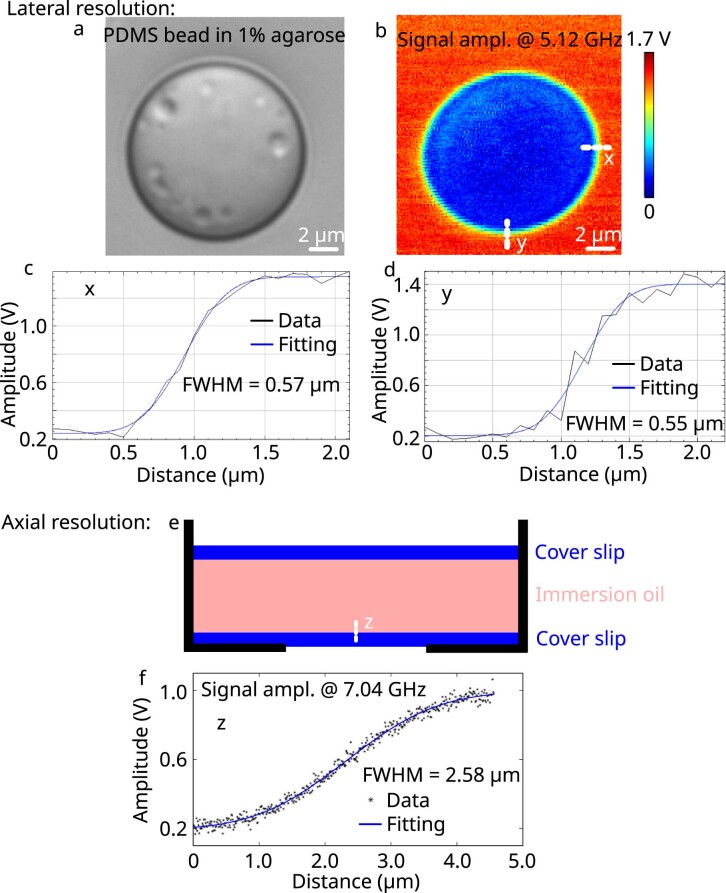
Extended Data Fig. 1. Characterization of the lateral (x and y) and axial (z) resolution of the pulsed-SBS microscope.
The lateral resolution (x and y) and axial resolution (z) were measured with a PDMS bead in 1% agarose and immersion oil sandwiched by two cover slips, respectively. (a) Brightfield image of a PDMS bead in 1% agarose. (b) Fitted signal amplitude at 5.12 GHz which is the Brillouin shift of 1% agarose. (c) and (d) are the amplitudes of Lorentzian fits to the spectrum, which are themselves fitted with an erf function at 5.12 GHz along the edge in the x and y direction, respectively. (e) Schematic diagram of immersion oil sandwiched between two coverslips, with the white line indicating the measurement scan. (f) The amplitude of Lorentzian fits to the spectrum at 7.04 GHz, which is the Brillouin shift of the immersion oil, and an erf-function fit to the data.

