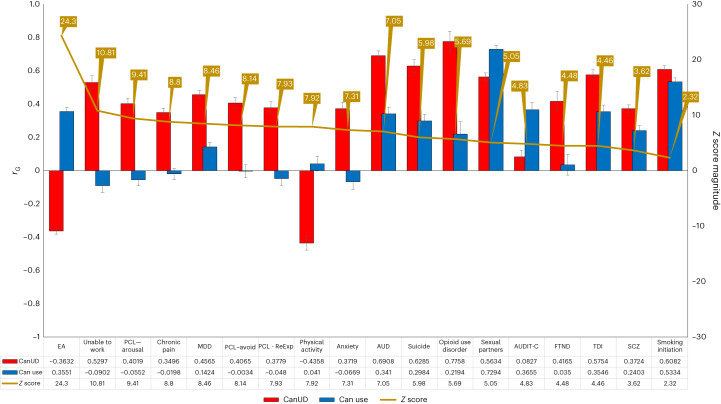
Fig. 2. Genetic correlations.
Comparison of genetic correlations between CanUD and cannabis use18. Left axis depicts the range of rG between 1 and −1. Red bars and blue bars depict the rG point estimate per trait for CanUD and cannabis use, respectively. Black error bars represent the standard error. Right axis displays the absolute magnitude of the Z statistic for the difference in rG between CanUD and cannabis use (gold line). SNP-based heritability for each comparison trait is included in the table. EA, educational attainment; ReExp, re-experience; AUDIT-C, Alcohol Use Disorders Identification Test-Consumption; TDI, Townsend deprivation index.

