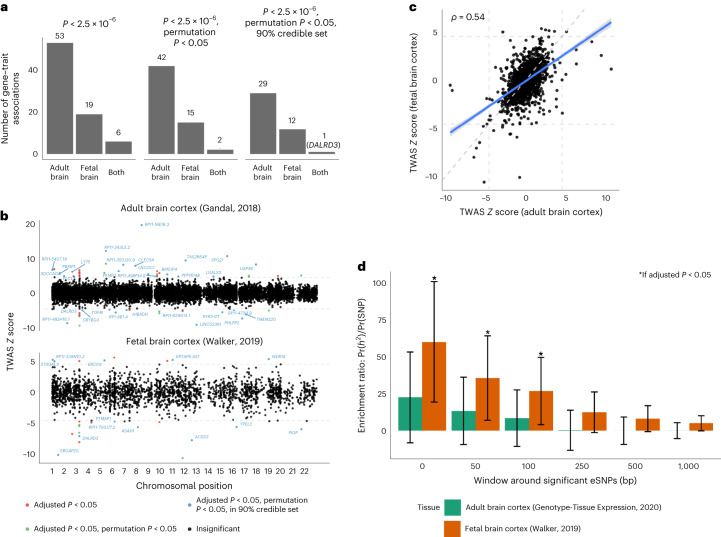
Fig. 3. TWAS and tissue enrichment of the EUR CanUD GWAS variants.
a, Number of TWAS gene–trait associations for adult and fetal brain frontal cortex, across significance thresholds. b, Miami plot of TWAS Z scores across analyses with adult (top) and fetal (bottom) brain frontal cortex. Genes are colored red if the gene passes transcriptome-wide significance, green if the gene additionally passes permutation testing and blue if the gene is estimated to be in the 90% credible set at the locus. All genes in blue are labeled. The horizontal line indicates threshold statistical significance following multiple testing correction. c, Scatterplot of standardized effect sizes (TWAS Z scores) across adult and fetal brain frontal cortex. A total of 10,722 genes were tested in adult tissue, while 2,293 genes were tested in fetal tissue. The dashed line indicates the expected relationship if no enrichment for adult or fetal brain. d, Enrichment ratio point estimate of proportion of SNP-based heritability explained by annotation and proportion of SNPs in annotation. Error bar shows a 95% Wald-type confidence interval. Bars marked with an asterisk indicate an enrichment ratio >1 at Benjamini–Hochberg adjusted P < 0.05.

