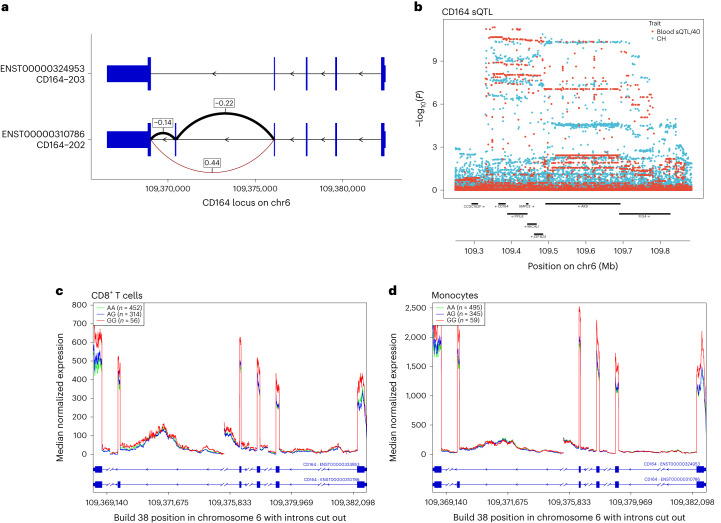
Fig. 5. CH GWAS variants are associated with splicing and expression of CD164.
a, Splice diagram of the two major CD164 mRNA isoforms from whole blood RNA-seq data. Blue bars depict exons and are wider in coding regions. Introns are depicted as black arrowed lines. The sQTL affects skipping or inclusion of exon 5. Effects (β in s.d. units) from linear regression of the CH risk rs3056655_A allele are as follows: E4 to E6 (β = 0.44, P = 3.04 × 10−302; E4 to E5 (β = −0.22, P = 3.29 × 10−72); E5 to E6 (β = −0.14, P = 4.16 × 10⁻³²). Thickness of the arcs indicates the overall usage of the different splice junctions. Black arcs indicate a reduction in usage in association with rs3056655_A, while the brown arc indicates an increase. b, Colocalization plot of the CD164 locus showing association from logistic/linear regression of rs3056655 with CH (blue) and with the E4 to E6 splice event in whole blood (red, −log10(P) is divided by 40 for scaling). c, RNA-seq coverage plot of CD164 from 822 CD8+ cytotoxic T cell samples, stratified by rs3056655 allele, showing reduced levels of expression in rs3056655_A (CH at-risk) heterozygotes and homozygotes. Note that rs3056655 is multi-allelic, but only the rs3056655_A (CH at-risk) and _G (CH protective) alleles were seen in the RNA-seq samples. d, As c, but RNA-seq from 899 monocyte samples.

