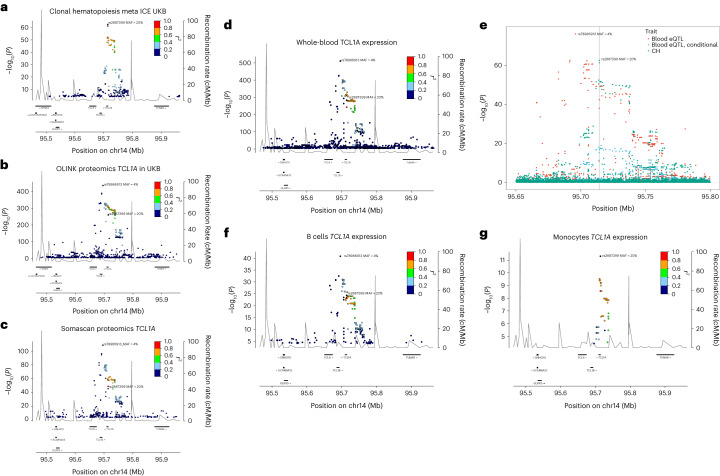
Fig. 6. CH risk variants, pQTL and eQTL at the TCL1A locus.
a, Locus zoom of CH GWAS results at TCL1A. b, Cis-pQTL analysis of variants affecting plasma protein levels of TCL1A in 47,133 UKB participants. c, As b, but from 35,559 ISL participants. d, RNA-seq cis-eQTL analysis of TCL1A in whole blood. e, Colocalization analysis of CH GWAS and blood eQTL signals at the TCL1A locus. The CH GWAS (green) and unadjusted eQTL signals (red) do not coincide. However, when the eQTL signal is adjusted for the 4% MAF rs78986913 variant (Padj values shown in blue), then the peaks overlap with a PP.H4 = 85% probability that they correspond to the same signal. The position of the CH GWAS sentinel variant rs2887399 is indicated by the gray vertical line. f, TCL1A eQTL from 758 B cell RNA samples. g, TCL1A eQTL from 884 monocyte samples. In all panels except e, the r2 focus is on rs2887399.

