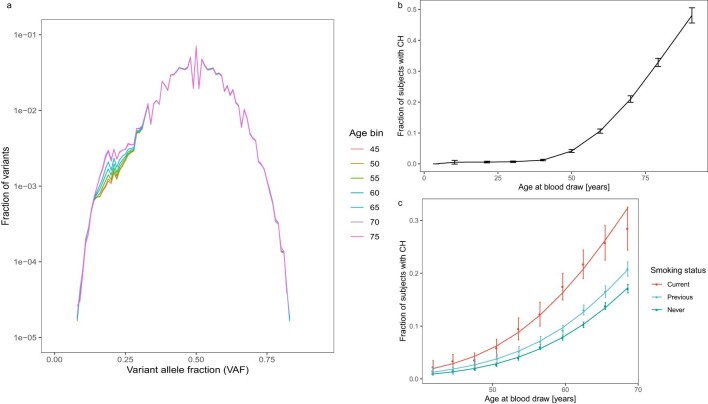
Extended Data Fig. 1. Age and smoking dependency of CH.
a, Frequency distribution in UKB of singleton mutations: Mutations that were observed only once in the cohort were plotted by variant allele fraction (VAF). The counts were further stratified by the age of the subject at blood draw. Note that there is a ‘bump’ in the distribution starting below a VAF of approximately 0.3 and that the size of this ‘bump’ is age dependent. This distribution was modeled to identify people with more than the expected number of low-VAF mutations, as explained further in the Methods. b, Proportion of subjects with CH increases with age. The line connects the observed CH proportions, error bars are 95%CI. Data are from the ISL sample (n = 45,510), which has a larger age range than UKB. c, Effects of current and previous smoking on CH by age: CH was modeled by age and stratified by current or previous smoking status using sex, Pack-Years and Years Since Stopped Smoking as covariates. Points correspond to observed CH proportions and error bars are 95%CI. Lines correspond to a logistic regression fit. Data are from the UKB sample (n = 130,709).

