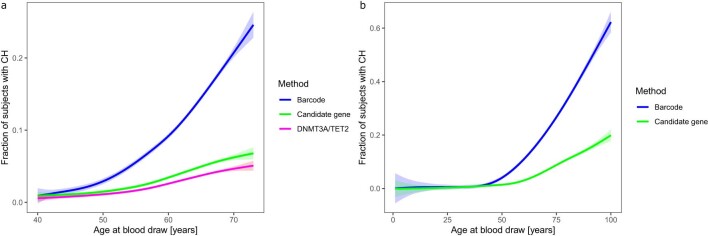
Extended Data Fig. 2. Only a minority of CH cases have a known CPLD mutation.
The proportion of subjects with barcode-CH by age is shown in blue. Proportions of subjects where a CPLD mutation had been identified (CPLD-CH) are in green and the proportion with a mutation in DNMT3A or TET2 are in magenta. CPLD mutations were defined as in ref. 13. The lines indicate a data fit using a generalized additive model with cubic splines. Shading indicates 95%CI. a, Data from UKB. b, Data from ISL.

