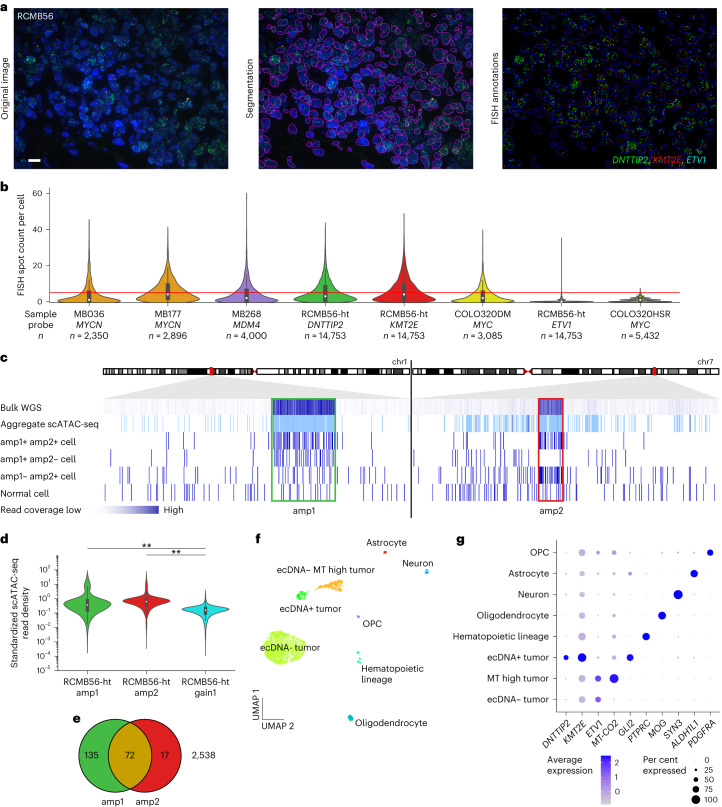
Fig. 3. Single-cell analysis reveals a distinct tumor cell population with high-copy ecDNA amplification.
a, Quantitative FISH image analysis of formalin-fixed paraffin-embedded (FFPE) tissue of the SHH medulloblastoma tumor RCMB56-ht. Representative image of 45 regions of one FFPE tissue slide. Scale bar, 10 μm. b, Distributions of FISH spot count per cell for amplified marker genes. MB036, MB177 and MB268 are SHH, Group 4 and SHH subgroup primary tumors23. COLO320DM and COLO32HSR are positive and negative controls with isogenic extrachromosomal or intrachromosomal MYC amplifications, respectively39. Red line indicates spot count = 5, the threshold used to classify amplified cells. Bar centers represent medians; bars indicate the interquartile range (IQR); and the whiskers extend to Q3 + 1.5 × IQR and Q1 – 1.5 × IQR. c, Read coverage at amp1 and amp2 loci in RCMB56-ht using various sequencing modalities. Each track is scaled independently. d, Standardized snATAC-seq read depth (z-scores) at the amp1, amp2 and gain1 regions of n = 2,762 RCMB56-ht cells. Bar centers represent medians; bars indicate the IQR; and the whiskers extend to Q3 + 1.5 × IQR and Q1 – 1.5 × IQR. Two-sided Mann–Whitney test, **P < 0.005. e, Number of cells in RCMB56-ht with significantly enriched read depth of amp1, amp2 or both. f, Uniform manifold approximation and projection (UMAP) projection of cell clusters detected in RCMB56-ht snRNA + ATAC-seq data using weighted nearest neighbors clustering. Cell clusters have been labeled based on overexpression of cell type-specific genes. g, Expression of marker genes across cell clusters of RCMB56-ht. OPC, oligodendrocyte precursor cell.

