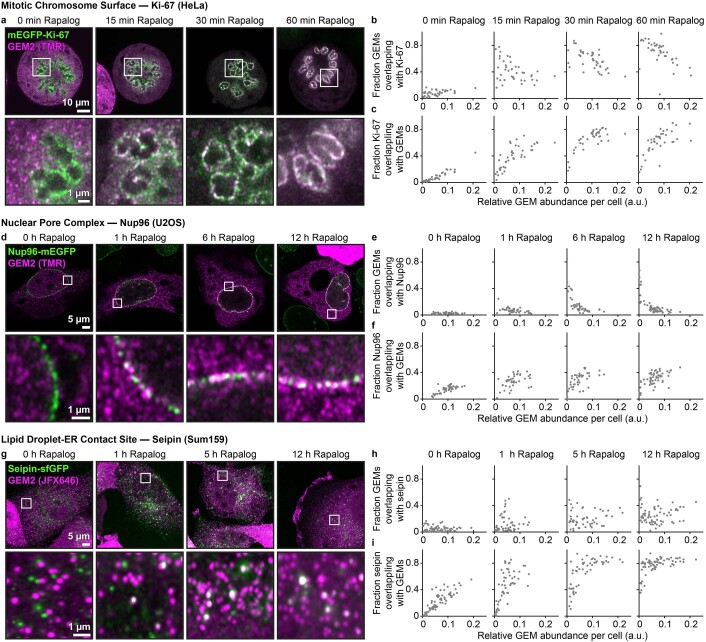
Extended Data Fig. 5. GEM2 recruitment dynamics is dependent on its abundance.
a, d, g, Time course of GEM2 recruitment to endogenous Ki-67, Nup96 and seipin. GEM2 and adaptor expression from the AAVS1 locus was induced with 24–48 h doxycycline treatment prior to rapalog treatment for the indicated durations. Image for seipin at 5 h is the same as in Fig. 2i, but rotated and with a larger field of view shown. b, Fractions of GEMs overlapping with the target as a function of relative GEM abundance, defined as the number of GEM-positive pixels divided by total cellular area per cell. Replotting of data presented in Fig. 2c. Lower GEM abundance gave rise to a higher fraction of GEMs at the target protein. c, Fractions of the target overlapping with GEMs as a function of relative GEM abundance per cell. Replotting of data presented in Fig. 2d. Longer rapalog treatment times increased labelling of Ki-67 by GEMs. Higher GEM abundance led to more complete coverage of Ki-67. These results demonstrate the importance of tuning GEM expression levels in the labelling experiment. e, Replotting of data in Fig. 2g. f, Replotting of data in Fig. 2h. h, Replotting of data in Fig. 2k. i, Replotting of data in Fig. 2l.

