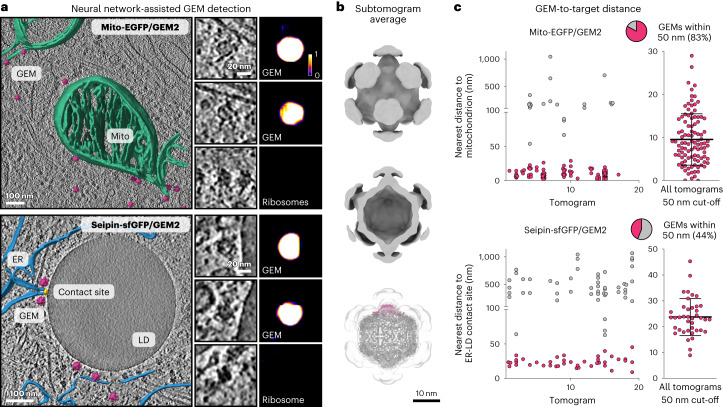
Fig. 3. CNN-based detection of GEM-labeled proteins.
a, Tomographic slices of GEM2-labeled Mito-EGFP on mitochondria (top, also Supplementary Video 3) and seipin-sfGFP near an ER-LD contact site (bottom). Magenta, GEM2 subtomogram averages pasted into the tomogram for visualization; green, mitochondria; blue, ER; yellow, ER-LD contact site. Insets show individual GEMs or ribosomes and corresponding CNN probability scores for each particle. b, GEM2 subtomogram average superposed with the structure of the encapsulin scaffold (bottom, PDB 6X8M), with one pentamer represented in magenta. c, Spatial distributions of GEMs relative to the outer mitochondrial membrane (top) and ER-LD contact site (bottom) per tomogram, n = 123 and 91 GEMs from 17 and 19 tomograms, respectively. Lines indicate mean and s.d. in the right panels. Pie charts indicate the proportion of GEMs within 50 nm of the target subcellular structure (magenta).

