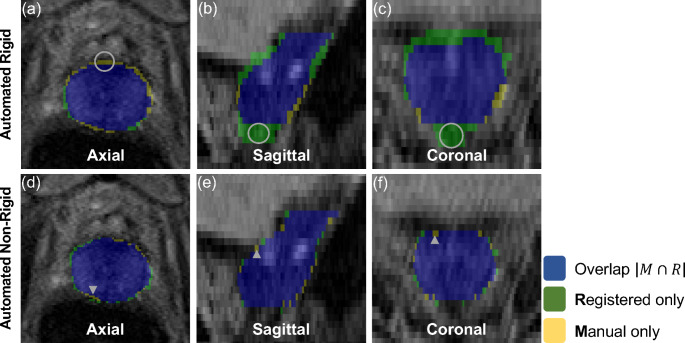
Fig. 1.
A representative view of the prostate contour overlap in each planar orientation (i.e., axial, sagittal and coronal) illustrates differences between the manual MR contours and the contours generated through the registration of the CT and MR images. The grey circles (row 1 (a-c)) and grey arrowheads (row 2 (d-f)) indicate the location of maximal HD (the largest minimum distance between the manual and registered contour) in each plane within the 3-dimensional image (i.e., axial (column 1), sagittal (column 2) and coronal (column 3)). The DSI measures the magnitude of overlap of two contours. M, manually contoured voxel; R; registered contour voxel; Blue label (M ∩ R), manual and registered contour overlap voxels; Green label (R), registered contour only voxels; Yellow label (M), manual contour only voxels; MR, magnetic resonance; CT, computed tomography; DSI, dice similarity index; HD, Hausdorff Distance

