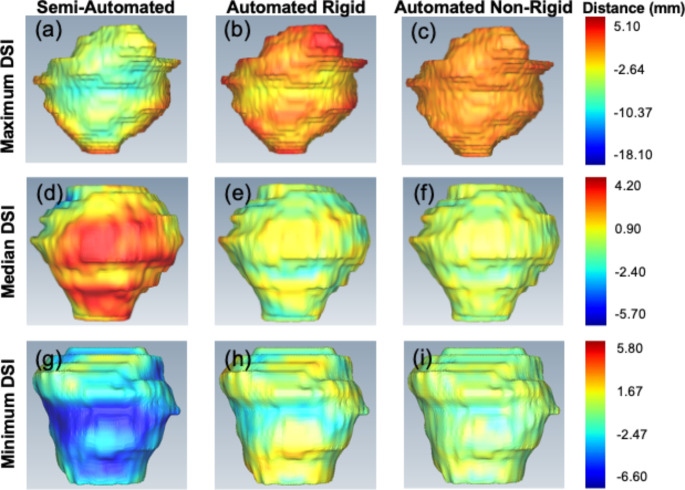
Fig. 5.
Coronal view prostate surface distance between the manual MR contours and the contours generated through the registration of the CT and MR images. Columns 1 (a, d, g), 2 (b, e, h) and 3 (c, f, i) display the semi-automated rigid-, automated rigid- and automated non-rigid-registered results, respectively. Rows 1 (a-c), 2 (d-f) and 3 (g-i) display the case which achieved the maximum-, median- and minimum DSI result using the automated non-rigid registration method, respectively. The signed distance scalar bar (rainbow colour map on right side of each row) has units in mm. MR, magnetic resonance; CT, computed tomography; DSI, dice similarity index

