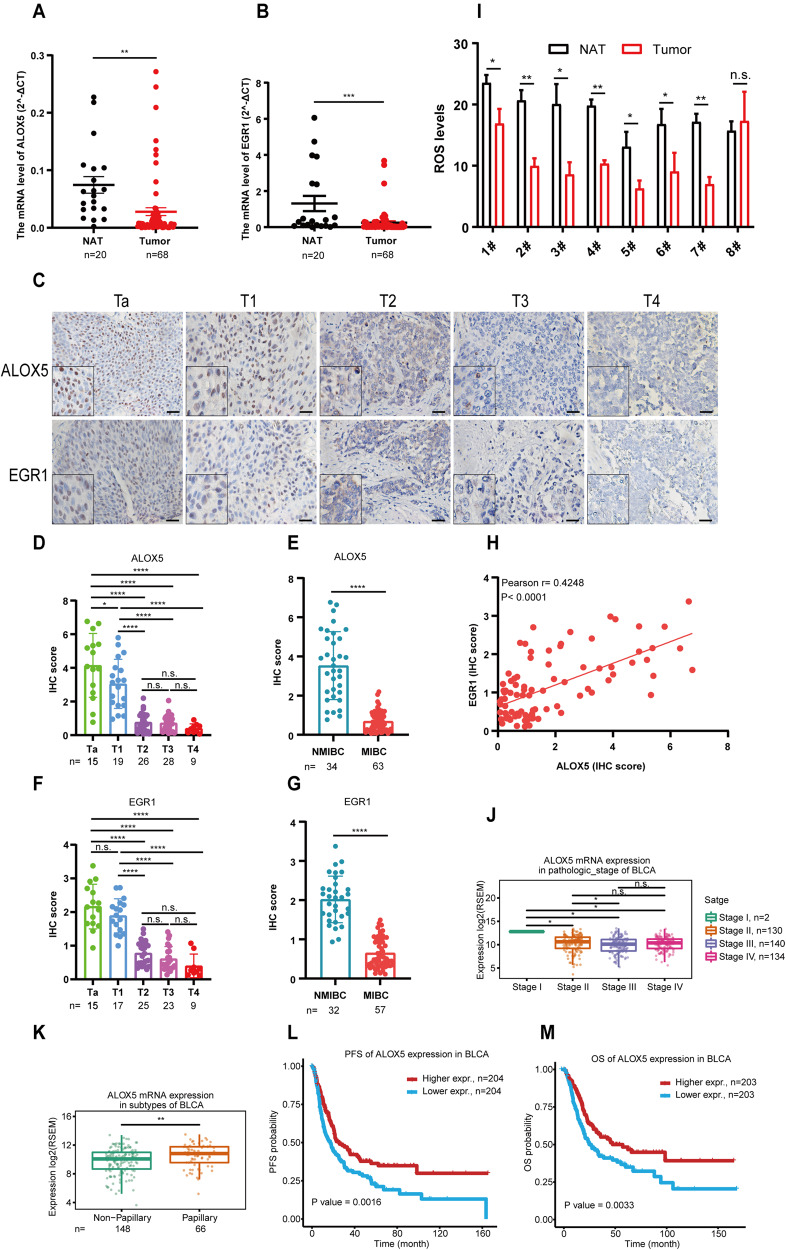
Fig. 8. The expression pattern of ALOX5 in BCa clinical specimens was negatively associated with tumor progression and outcome.
A, B The expression level of ALOX5 and EGR1 in BCa clinical specimens. NAT (normal adjacent tissue, n = 20). Tumor (n = 68). The data are represented as mean ± SEM. C–G Representative images of IHC staining in BCa clinical specimens, and statistical analyses of IHC score. Scale bars, 100 μm. H Pearson correlation analysis of ALOX5 and EGR1 IHC scores. I ROS level in BCa clinical specimens. J, K The expression level of ALOX5 in TCGA database. L, M Kaplan–Meier analysis of the correlation between ALOX5 expression and prognosis outcome. n.s., represent no significance, *p < 0.05, **p < 0.01, ***p < 0.001, ****p < 0.0001. The data are represented as mean ± SD.

