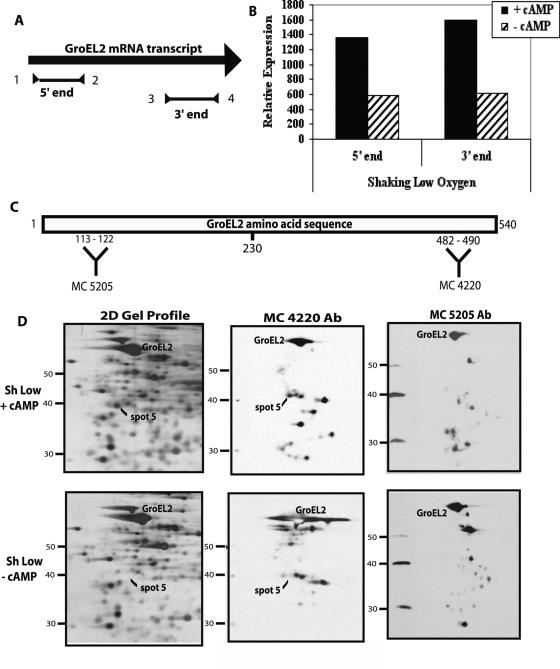
FIG. 4.
Testing GroEL2 alternate transcriptional start site versus protein cleavage models. (A) Schematic of the GroEL2 mRNA transcript indicating the RT-PCR products obtained from the 5′ end (primers 1 and 2) or 3′ end (primers 3 and 4). (B) RT-PCR quantitation data indicating cAMP-mediated transcriptional upregulation from both the 5′ and 3′ ends of the GroEL2 transcript. BCG cultures were grown with (solid bars) or without (hatched bars) exogenous cAMP (10 mM) under shaking low-oxygen (1.3% O2, 5% CO2) conditions. (C) Schematic of the GroEL2 amino acid sequence, indicating the region of protein recognized by antibodies MC 4220 and MC 5205. (D) Western blot of shaking low-oxygen 2-D gel profiles (left panel) with (+) or without (−) exogenous cAMP (10 mM) and probed with either MC 4220 (middle panel) or MC 5205 (right panel) to detect possible cleavage products of GroEL2.

