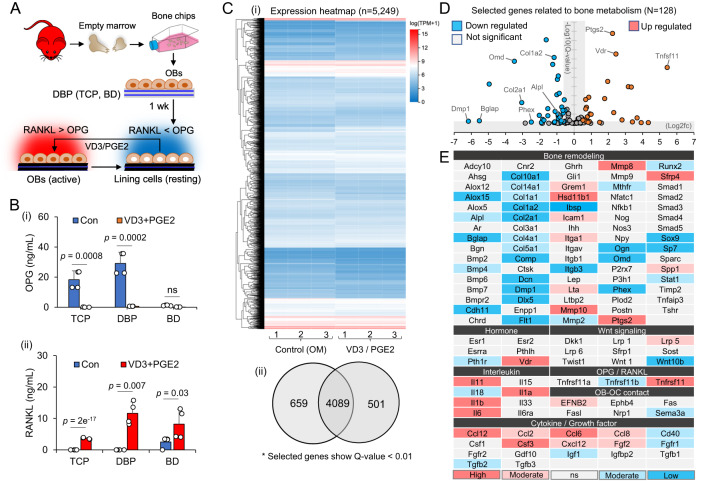
Fig. 5. Comparative characterization of osteoblast secretion and gene expression profiles in DBP between the resting and stimulated states.
A Schematic of manipulating osteoblast metabolic state; Osteoblasts cultured on DBP for 1 week acquire resting state lining cell phenotype. When stimulated with vitamin D3 (VD3) and prostaglandin E2 (PGE2), lining cells revert to active osteoblasts. The red mouse image has been obtained from Clker.com and flyclipart.com. B Comparative RANKL and OPG secretion profiles of osteoblasts on TCP, DBP, and BD (i) before and (ii) after VD3/PGE2 stimulation (n = 4 independent samples). The data are presented as mean ± standard deviation. P-values are derived from unpaired two-tailed t-tests. ns not significant (p > 0.05). Related source data are provided as a Source Data file. C (i) Comparative RNA-seq heat-map of osteoblasts on DBP between resting and VD3/PGE2 stimulated states for selected genes having the Q-value lower than 0.01 (total: 5,249). (ii) Distinct and overlapped gene numbers between resting and activated osteogenic cells. D A volcano plot of 128 selected bone remodeling-related genes (up-regulated: Log2fc > 0.5, down-regulated: Log2fc < −0.5). E List of 128 genes and their profiles of up- and down-regulation, and non-significant changes (different colors to divide them further into high or low: 1 <∣ Log2fc ∣, moderate: 0.5 <∣ Log2fc ∣ <1). Original RNA-seq results are provided as a Supplementary Data.

