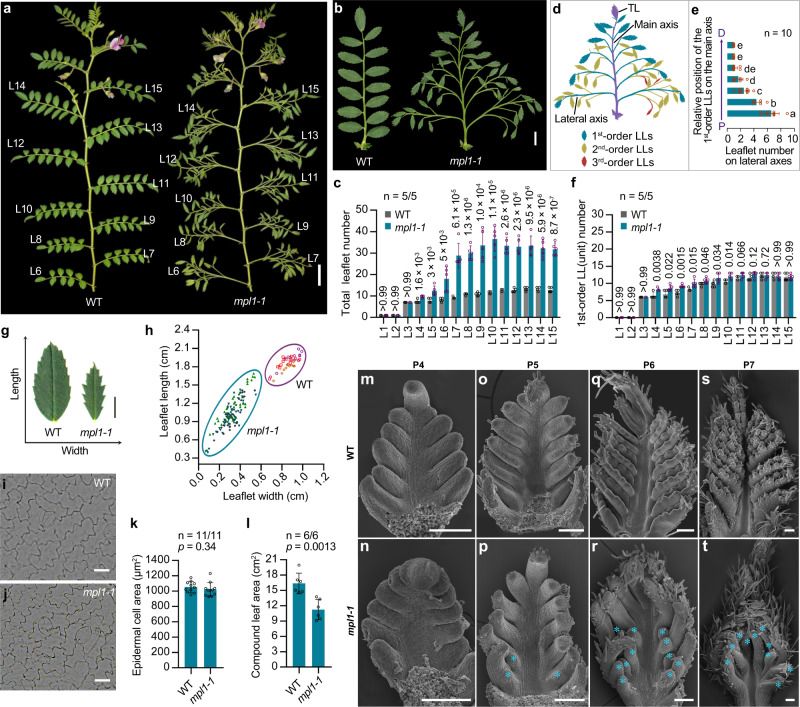
Fig. 2. Phenotypic comparison of WT and multiple-pinnate leaf1-1 (mpl1-1) mutant of chickpea.
a Image of 10-week-old WT (cv. CDC Frontiers) and mpl1-1 (PI587041) plants. L6–L15, leaf nodes 6–15, numbered from the cotyledon upward. b Mature compound leaves at the L12 node. c Quantification of total leaflet number in compound leaves from nodes L1–L15. Data shows mean ± SD from 5 plants. The values above bars represent the p-value estimated by the two-sided unpaired Student’s t test for the comparison between WT and the mpl1-1 mutant. d Illustration showing multiple orders of leaflet organization in a representative mpl1-1 leaf. e Number of second- and third-order leaflets on lateral axes in a compound leaf. The x axis represents the leaflet number; the y axis represents the relative location of the lateral axes (the first-order LLs) along the main proximodistal axis (the main rachis). Data shows mean ± SD of 10 leaves. Different letters on the right of each bar indicate significant differences using the two-sided unpaired Student’s t test (p < 0.05). f Quantification of the 1st-order lateral leaflet (LL) number in compound leaves from nodes L1–L15. Data shows mean ± SD from 5 plants. The values above bars represent the p-value estimated by the two-sided unpaired Student’s t test for the comparison between WT and the mpl1-1 mutant. g Representative leaflets dissected from WT and mpl1−1 leaves. h Measurements of the leaflet length and width. Each label indicates one leaflet, and leaflets from a same compound are marked by same labels. Three mature compound leaves from the L12 node were measured for each genotype. Representative images of adaxial epidermal cells of mature WT (i) and mpl1-1 (j) leaflets. k Average area of adaxial epidermal cells of WT and mpl1-1 leaflets. Data shows mean ± SD of 11 cells. l Measurements of the blade area of compound leaves at the 12th node. Data shows mean ± SD of 6 leaves. The values above columns in (k and l) represent the p-value estimated using the two-sided unpaired Student’s t test. SEM images of compound leaf primordia at the P4 (m, n), P5 (o, p), P6 (q, r) and P7 (s, t) stages. Cyan asterisk indicates the 2nd-order LL primordia in mpl1-1. Similar results were obtained from three biological replicates for each tissue or organ. Scale bars, 1 cm in (a), 2 cm in (b), 20 μm in (i, j), 100 μm in (m–t). Source data for Fig. 2c, e, f, h, k, l are provided as a Source Data file.

