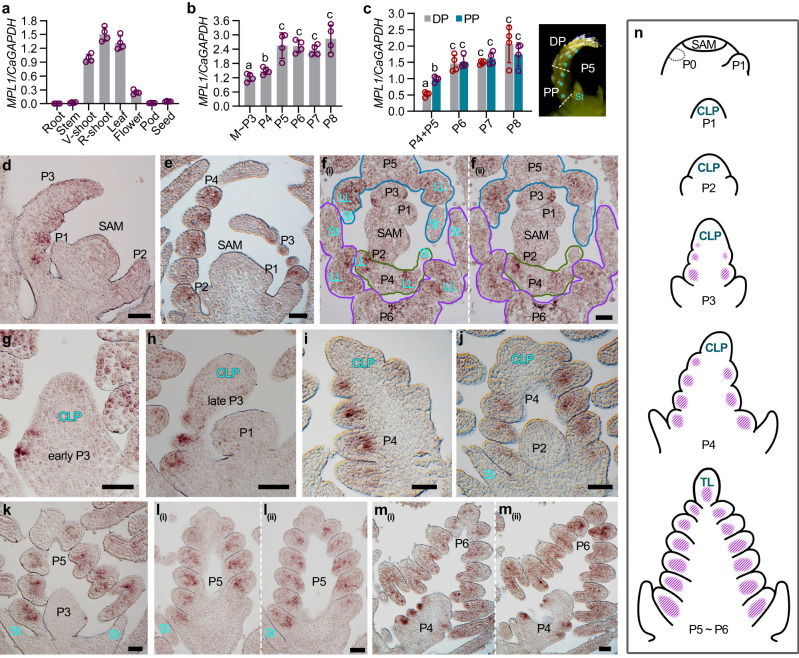
Fig. 4. The spatio-temporal expression pattern of MPL1 during compound leaf development of chickpea.
a RT–qPCR analysis of MPL1 mRNA expression levels in different tissues of WT (cv. CDC Frontiers) plants. b RT–qPCR analysis of MPL1 mRNA expression levels at different leaf developmental stages. M ~ P3: SAM with P1-P3 leaf primordia; P4-P8: leaf primordia at indicated developmental stages. c RT–qPCR analysis of MPL1 mRNA expression levels in different portions of the P4–P8 leaf primordia. The different leaf portions are illustrated to the right with the dotted line showing the site of dissection. PP, Proximal Portion; DP, Distal Portion. Cyan asterisk indicates the LL primordia. Data shows mean ± SD of 4 biological replicates in (a–c). The value above columns in (a) represents the p-value estimated using the two-sided unpaired Student’s t test. Different letters above bars in (b and c) indicate significant differences using the two-sided unpaired Student’s t test (p < 0.05). RNA in situ hybridization of MPL1. Shown are single longitudinal (d, e) and two serial transverse (f) sections of the SAM with several leaf primordia, and single (g–k) and serial (l, m) longitudinal sections of the leaf primordia at the indicated developmental stages. Similar results were obtained from three independent experiments. St, Stipule; LL: Lateral leaflet; TL: Terminal leaflet. Scale bars, 50 μm. n Diagrams of compound leaf primordia at successive stages of ontogeny and the spatio-temporal expression pattern of MPL1 (purple). Source data for Fig. 4a–c are provided as a Source Data file.

