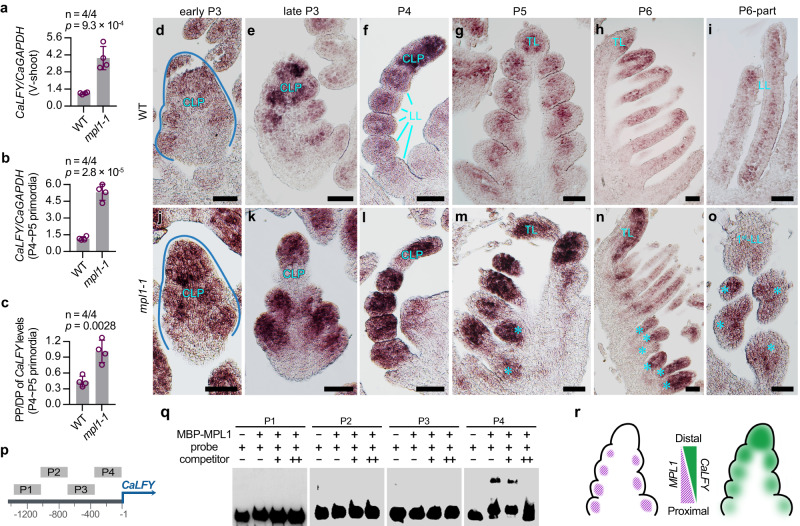
Fig. 6. MPL1 negatively regulates CaLFY expression during the compound leaf development of chickpea.
RT–PCR analysis of CaLFY expression in vegetative-shoots (a) and leaf primordia (b) of WT and mpl1-1. c The ratio of CaLFY expression level in Proximal Portion (PP) to that in Pistal Portion (DP) of the P4–P5 leaf primordia of WT and mpl1-1. Data shows mean ± SD of 4 biological replicates in (a–c). The values above columns in (a–c) represents the p-value estimated by the two-sided unpaired Student’s t test. d–o RNA in situ hybridization of CaLFY mRNA in leaf primordia of WT and mpl1-1. Shown are coronal sections through leaf primordia at the early P3 (d, j), late P3 (e, k), and P5 (g, m) stages, sagittal sections through leaf primordia at the P4 (f, l) and P6 (h, n) stages, and sections of parts of the P6 leaf primordia (i, o). Cyan asterisks indicate the 2nd-order lateral leaflet (LL) primordia in mpl1-1. Similar results were obtained from three independent experiments. Scale bars, 50 μm. p Diagram of the CaLFY promoter including P1-P4 sequences used for electrophoretic mobility shift assay (EMSA). q EMSA analysis of P1-P4 sequences labeled with biotin in the presence and absence of purified recombinant MBP–MPL1 proteins. Competition binding was performed in the presence of 10-fold (+) or 50-fold (++) unlabeled probes. Similar results were obtained from three independent experiments. r Model for MPL1 and CaLFY expression patterns and their interaction in WT P4 leaf primordium. Source data for Figs. 6a–q are provided as a Source Data file.

