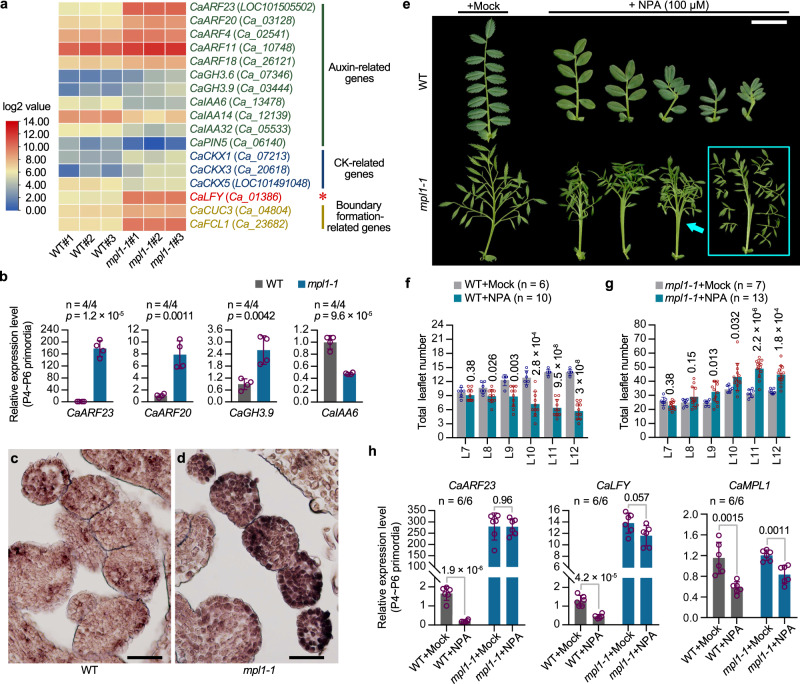
Fig. 7. Transcriptional control of the auxin signaling pathway during compound leaf patterning by MPL1.
a Gene expression differences between WT and mpl1-1 shoots using RNA-seq transcriptome analysis. A heat map was created using fragments per kilobase of exon model per million mapped reads (FPKM). WT and mpl1-1 biological replicates were plotted in the left three columns and right three columns, respectively. b RT–qPCR validation of expression differences of certain selected genes between WT and mpl1-1. CaGAPDH was used as an internal reference gene. The samples used for the analysis consist of a mixture of P4 ~ P6 leaf primordia dissected from the shoot apex. Data shows mean ± SD of 4 biological replicates. The values above each column represent the p-values estimated by the two-sided unpaired Student’s t test. c, d RNA in situ hybridization of CaARF23 mRNA in P4 leaf primordia of WT and mpl1-1. Similar results were obtained from three independent experiments. Scale bars, 50 μm. e Compound leaf development responses to the auxin transport inhibitor N−1-naphthylphthalamic acid (NPA). Two-week-old plants of WT and mpl1-1 grown in soil were sprayed by mock or 100 μM NPA once every three day, for a duration of 15 days; compound leaves from node 11 (the third internode beneath the shoot apex) were photographed at three weeks after the spraying stopped. Scale bar, 2 cm. Quantification of total leaflet number in compound leaves from node 7 to node 12 of 7-week-old WT (f) and mpl1-1 (g) plants after spraying with mock (indicated as “+Mock”) or 100 μM NPA solutions (indicated as “+NPA”). Data shows mean ± SD (n = 6 “WT+Mock” plants, 10 “WT + NPA” plants, 7 “mpl1−1+Mock” plants, and 13 “mpl1-1 + NPA” plants). The values above bars represent the p-values of the two-sided unpaired Student’s t test between the “+Mock” and “+NPA” groups. h RT–PCR analysis of CaARF23 (left), CaLFY (middle) and MPL1 (right) expression levels in leaf primordia of WT and mpl1-1 after spraying with mock or 100 μM NPA solutions. CaGAPDH was used as an internal reference gene. The samples consist of a mixture of P4 to P6 leaf primordia. Data shows mean ± SD of 6 biological replicates. The values above columns represent the p-values estimated by the two-sided unpaired Student’s t test between the “+Mock” and “+NPA” groups. Source data for Fig. 7b, f, g, h are provided as a Source Data file.

