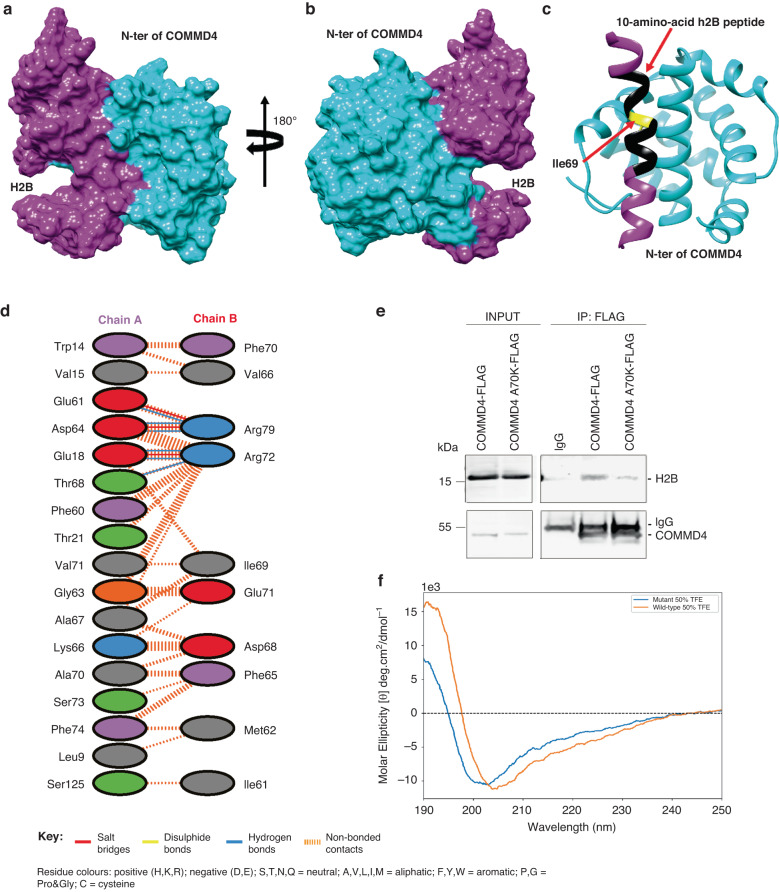
Fig. 1. The binding pose of H2B and COMMD4.
a, b Surface representations with different perspectives of the binding complex of COMMD4 N-terminal domain (cyan) and H2B (magenta) are shown. For the sake of clarity, surfaces of the N-terminal 35 residues in H2B that are not involved in binding to COMMD4 are not displayed in (a) and (b). c Shown is the ribbon representation of COMMD4 N-terminal domain (cyan) in complex with a H2B region (magenta) that contributes to the major binding of H2B to COMMD4. The identified 10-amino acid H2B peptide incorporating the key amino acids dominating the binding of H2B to COMMD4 is shown in black. The residue Ile69 mutated in H2BMUT is highlighted in yellow (d). Shown is the schematic diagram of the interactions between the two proteins displayed in (c). The number of H-bond lines between any two residues indicates the number of potential hydrogen bonds between them. For non-bonded contacts, which can be plentiful, the width of the striped line is proportional to the number of atomic contacts. e A FLAG pull-down experiment demonstrating that compared to COMMD4-FLAG expressing cells, cells expressing A70K-FLAG mutant showed reduced binding with H2B. IgG shows the loading. f CD spectra of the H2BWTpep (wild-type) and H2BMUT1pep (mutant) peptides in 50% TFE. Both peptides present peak ellipticity maxima at 190 nm, with H2BWTpep being more pronounced. The H2BWTpep presents a peak minimum at 204 nm, while the H2BMUT1pep minimum shifts towards 202 nm. These spectra indicate mixed helical and denatured/extended conformations, with H2BWTpep possessing a more helical secondary structure than H2BMUT1pep, which possesses little helical structure even in 50% TFE.

