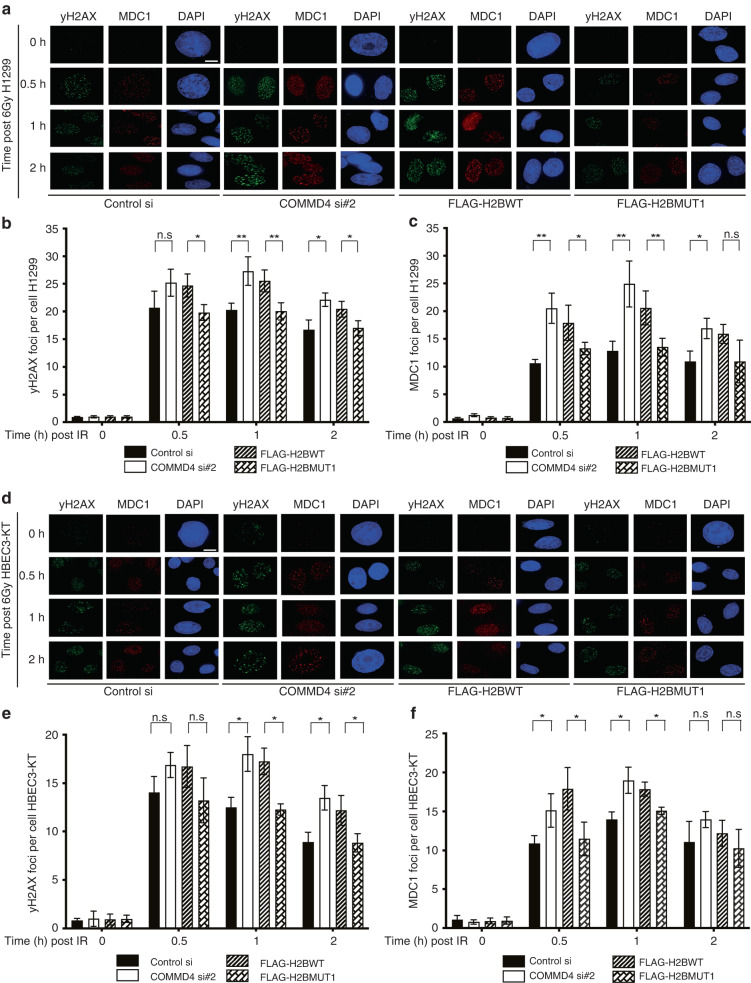
Fig. 4. Induction of DSBs in NSCLC and control cells.
a Immunofluorescence staining of H1299 NSCLC cells transfected with control or COMMD4 siRNA #2 and FLAG-H2BWT or FLAG-H2BMUT1 is shown. 48–72 h post-siRNA transfection and 24 h post-FLAG H2B transfection, cells were treated with 6 Gy IR and the recovery time points (h) post-IR treatment is shown. b, c Plot of γH2AX and MDC1 foci numbers for (a). d Immunofluorescence staining of HBEC3-KT control cells as in (a). e, f Plot of γH2AX and MDC1 foci numbers for (d). n.s; not significant, *; P < 0.05 and **; P < 0.005. Error bars represent mean ± SD from three independent experiments where 50 cells were quantified per condition. γH2AX (green), MDC1 (red) and DAPI shows the nucleus. Scale bar denotes 5 μm.

