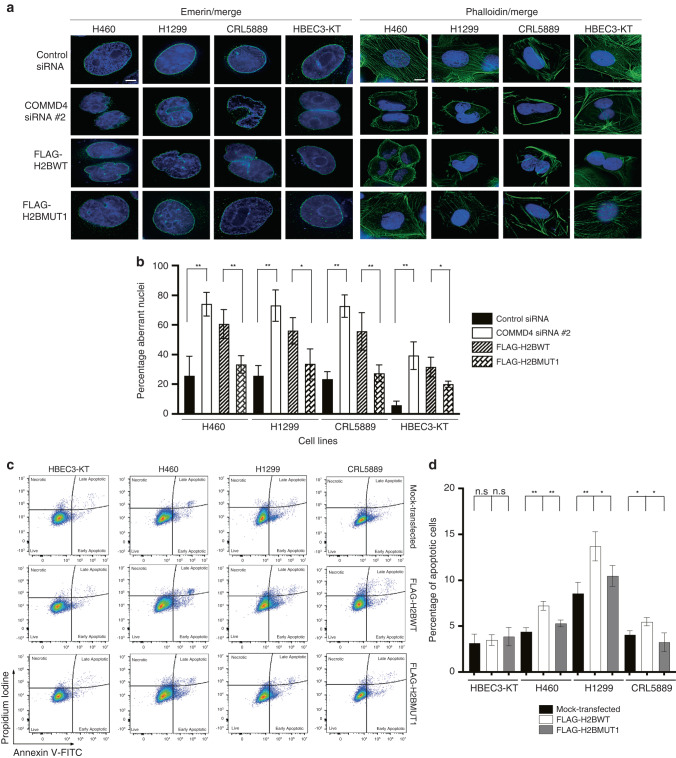
Fig. 5. Induction of mitotic catastrophe and apoptosis in NSCLC cells.
a Emerin and phalloidin staining respectively in three NSCLC and control HBEC3-KT cells. DAPI shows the nucleus and emerin and phalloidin staining are shown in green. b Quantification of the percentage aberrant nuclei for (a). Asterix (*) denotes *P < 0.05 and ** P < 0.005 from 100 cells counted. Error bars represent mean ± SD. Scale bar denotes 5 μm for Emerin and 15 μm for Phalloidin. (c). Flow cytometry analyses of apoptotic cells transfected with FLAG-H2BWT, FLAG-H2BMUT1 or mock-transfected. The live cells were stained with Annexin V-FITC and propidium iodide and analysed by flow cytometer. Live, necrotic and apoptotic cells are shown. d The percentage apoptotic cells are shown, which was calculated from by adding the early and late apoptotic cells. *P < 0.05, **P < 0.005, n.s; not significant. Error bars represent mean ± S.D from three independent experiments.

