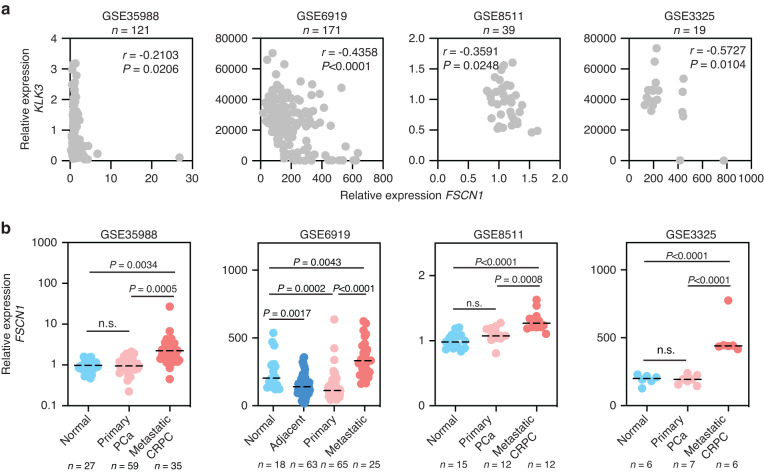
Fig. 2. Expression of FSCN1 in normal and cancerous human prostate.
a Scatter plots showing correlation of relative gene expression between FSCN1 and KLK3 in gene expression datasets GSE35988, GSE6919, GSE8511 and GSE3325. Pearson’s test was used to determine the correlation coefficient and statistical significance. b Comparison of FSCN1 expression profiles in normal prostate (normal or adjacent), primary prostate cancer (primary PCa) and in metastatic prostate cancer (metastatic PCa or CRPC) cells using gene expression datasets GSE35988, GSE6919, GSE8511, GSE3325. Statistical significance was determined by one-way analysis of variance (ANOVA) with a Tukey multiple comparison test.

