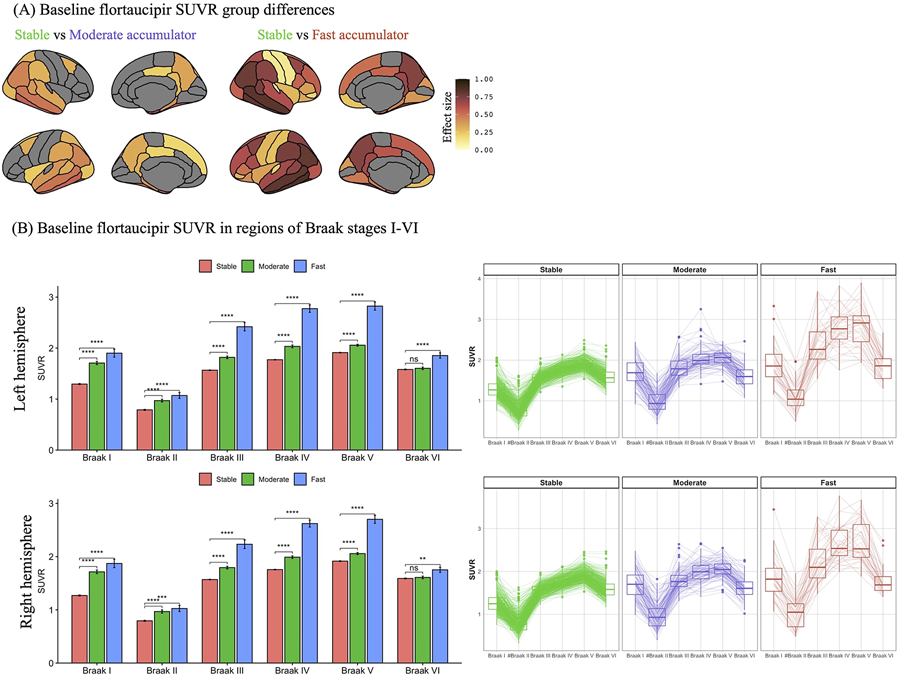
Figure 3.
Baseline characteristics of the three distinct flortaucipir progression groups in the ADNI, AVID-05, and HABS cohorts. Plots represent estimated baseline flortaucipir positron emission tomography (PET) standard uptake value ratios (SUVRs) effect sizes (FDR adjusted p<0.01) between accumulators and their stable counterparts in anatomical regions-of-interest (A). (B) The radar and box plots represent baseline flortaucipir PET Braak SUVRs within each group. #Braak II region was not included in the clustering model. * and *** represent statistically significant group differences compared to the stable group at p<0.05 and p<10−16, respectively.

