Fig. 4.
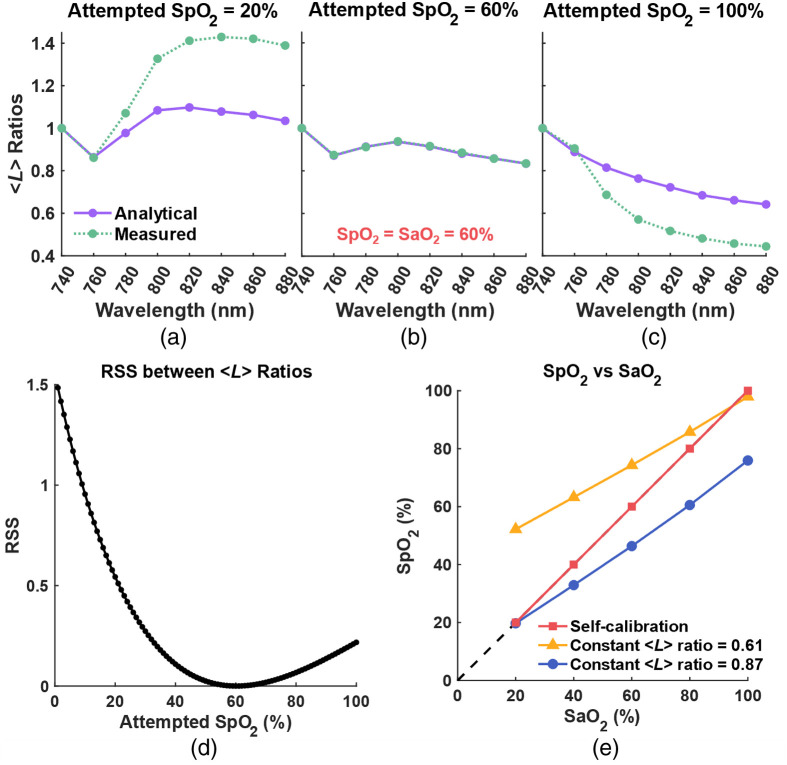
(a)–(c) Comparison between analytical (solid purple) and measured (dotted green) ratio at , 60%, and 100%, respectively. (d) RSS between analytical and measured ratio at to 100%. (e) Comparison between calculated by the self-calibrated algorithm (red square) and the conventional method with constant ratio = 0.61 (yellow triangle) and 0.87 (blue circle).

