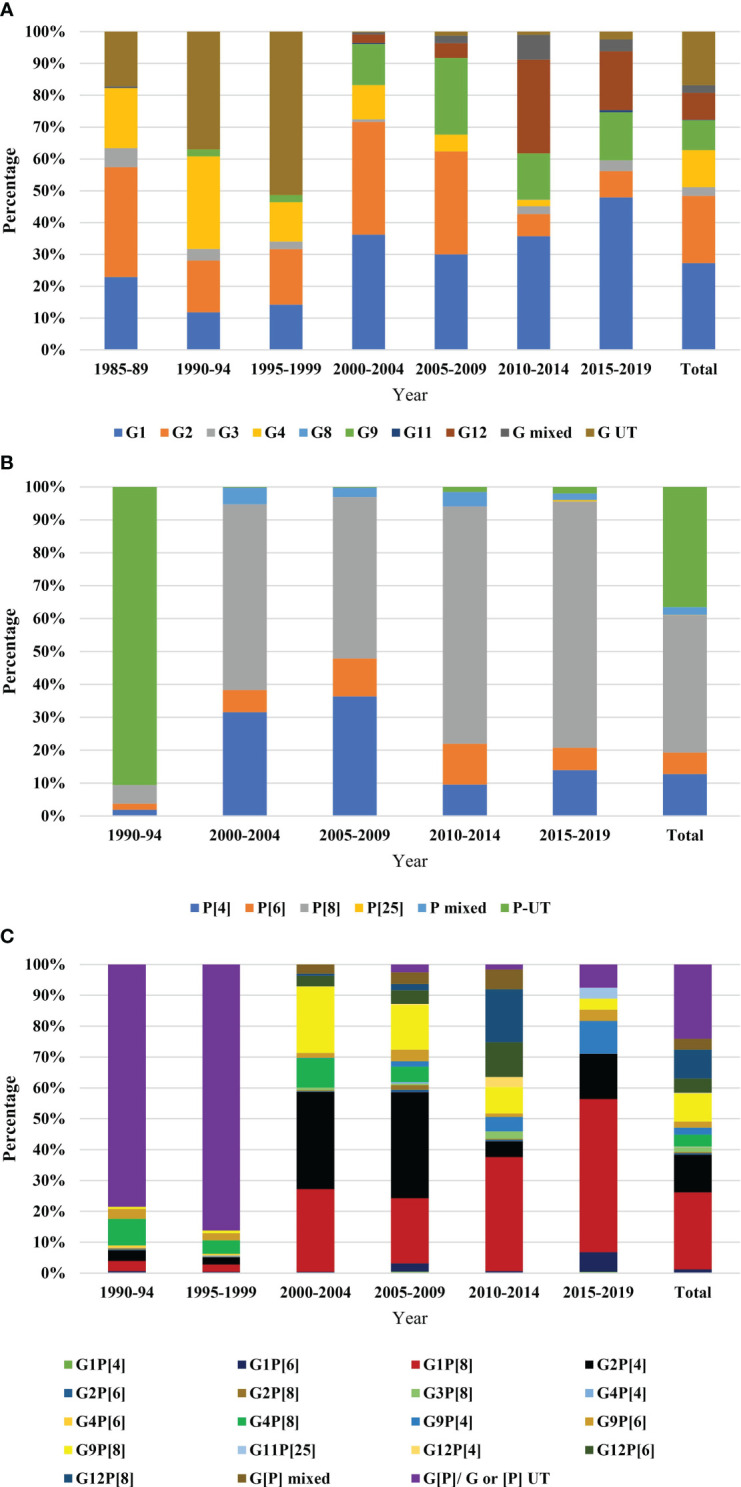
Figure 4.

Year-wise genotypic distribution of rotavirus (A) G-type, data were represented from 1985 to 2019. Five years interval was used. The bar in the right side represented total diversity during 1985-2019, (B) P-type, data were represented from 1990 to 2019. Five years interval was used. The bar in the right side represented total diversity during 1990-2019, and (C) G[P]-types, data were represented from 1990 to 2019. Five years interval was used. The bar in the right side represented total diversity during 1990-2019.
