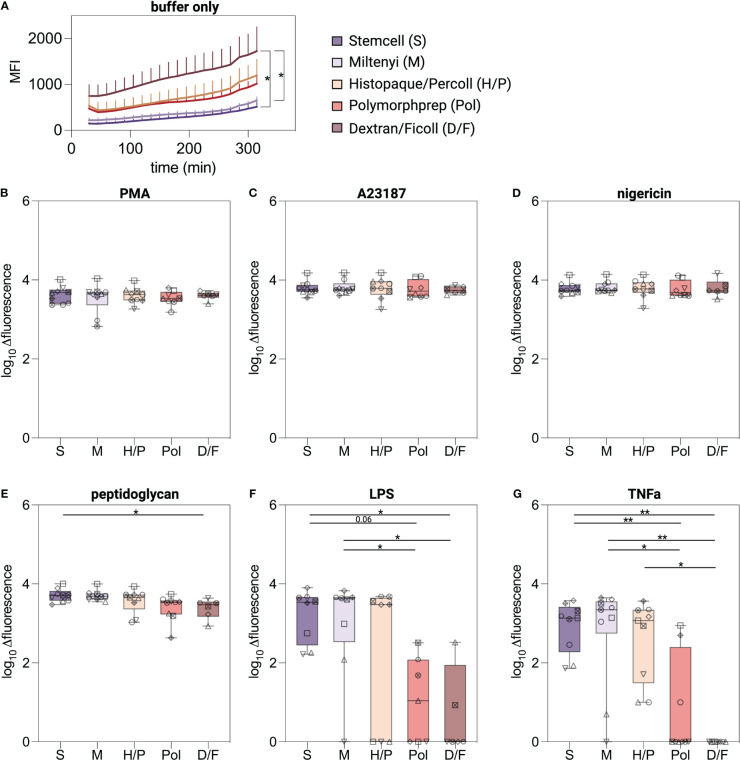
Figure 5.
Lytic cell death induced in isolated neutrophils. (A–G) Extracellular DNA and DNA of cells with compromised plasma membrane were measured using a plate reader assay. Lytic cell death was monitored for 5 hours at 37°C from neutrophils isolated by indicated methods and stimulated with classical NETosis stimuli. Values are represented as delta fluorescence. Data are represented as boxplots; whiskers range from the minimum to maximum value and inside each box (25th to 75th percentile) the median is represented; n = 6-9. Individual donors are indicated with distinct symbols. Results were compared using a one-way ANOVA with post-hoc Tukey’s multiple comparisons or Kruskal-Wallis test followed by Dunn’s post-test. P values are represented as *P< 0.05, **P< 0.01.

