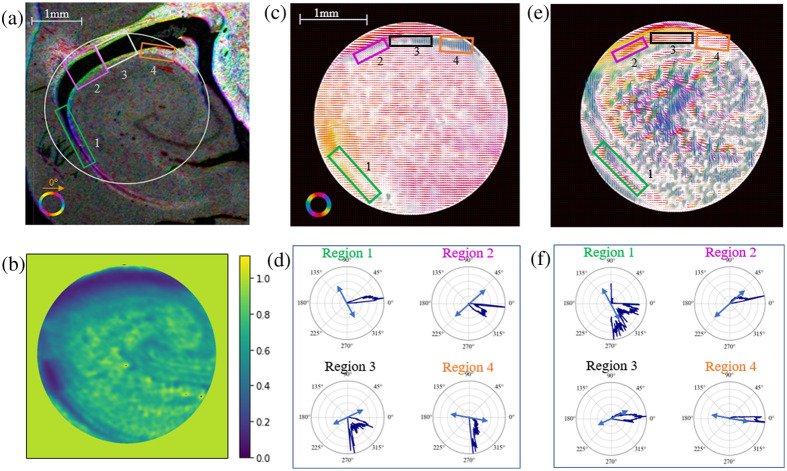
Fig. 11.
(a) DiI stained hippocampus slide imaged with a slide microscope and processed with orientationj in imagej. (b) Depolarization PLI data of hippocampus region. (c) Retardance angle PLI data of hippocampus region scaled by retardance. (d) Retardance angle distributions of selected regions shown with dominant direction indicated by orientationj overlaid in a blue arrow. (e) Diattenuation angle PLI data of hippocampus region scaled by diattenuation. (f) Diattenuation angle distributions of selected regions shown with dominant direction indicated by orientationj overlaid in a blue arrow. For the angular data shown here: 0 deg is aligned horizontally, pointing to the right, and positive angles are measured counterclockwise.

