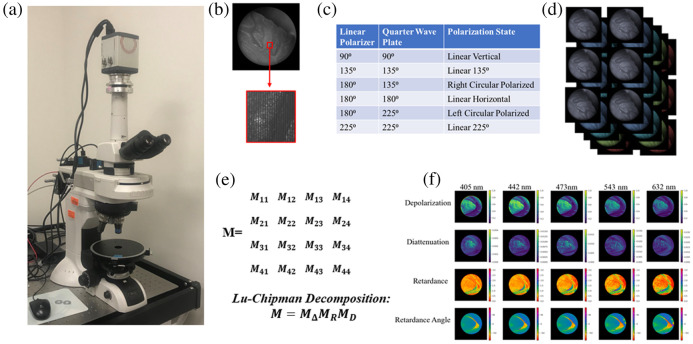
Fig. 3.
(a) Photograph of polarimetry microscope. (b) Example image from the polarimeter with detail of Stokes parameters encoded into frequencies due to Savart plate polarization state analyzer. (c) Summary of polarization states used as illumination for the system. (d) Set of six images taken for each of the five wavelengths. (e) Resulting Mueller matrix output and Lu–Chipman decomposition. (f) Decomposed pixel-wise maps of depolarization, diattenuation, retardance, and retardance angle over each of the imaging wavelengths.

