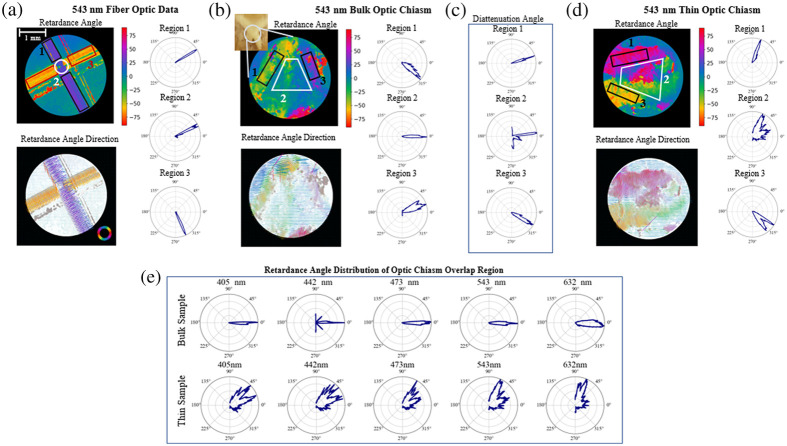
Fig. 5.
(a) Crossing fiber optic retardance angle data with angular distribution of retardance angle shown for the top fiber, bottom fiber, and crossing fiber region on the right. (b) Bulk optic chiasm retardance angle data with angular distributions of the upper region, lower region, and crossing fiber region shown on the right. (c) Optic chiasm diattenuation angle distributions of the upper region, lower region, and crossing fiber region. (d) Thin, thick, optic chiasm slice retardance angle data with angular distributions of the upper region, lower region and crossing fiber region shown on the right. (e) Optic chiasm retardance angle data distributions within the crossing fiber region shown across five different imaging wavelengths for bulk sample (top row) and thin sectioned sample (bottom row). For the angular data shown here: 0 deg is aligned horizontally, pointing to the right in (a) and (d), and vertically pointing down for (b) and (c). Positive are measured counterclockwise.

