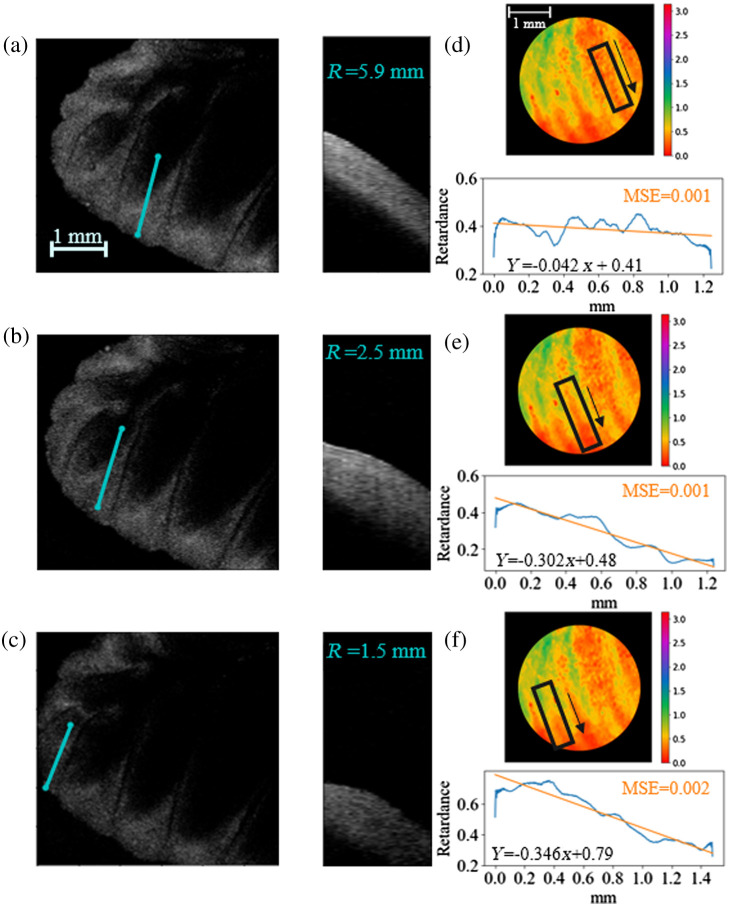
Fig. 8.
(a)–(c) Images of cerebellum taken with OCT shown from above on the left, cross-sectional region taken along the indicated blue line with the approximated radius of curvature of the cross section noted on the right. (d)–(f) Corresponding cerebellum regions imaged with the PLI system with mean retardance values taken along similar lines for comparison.

