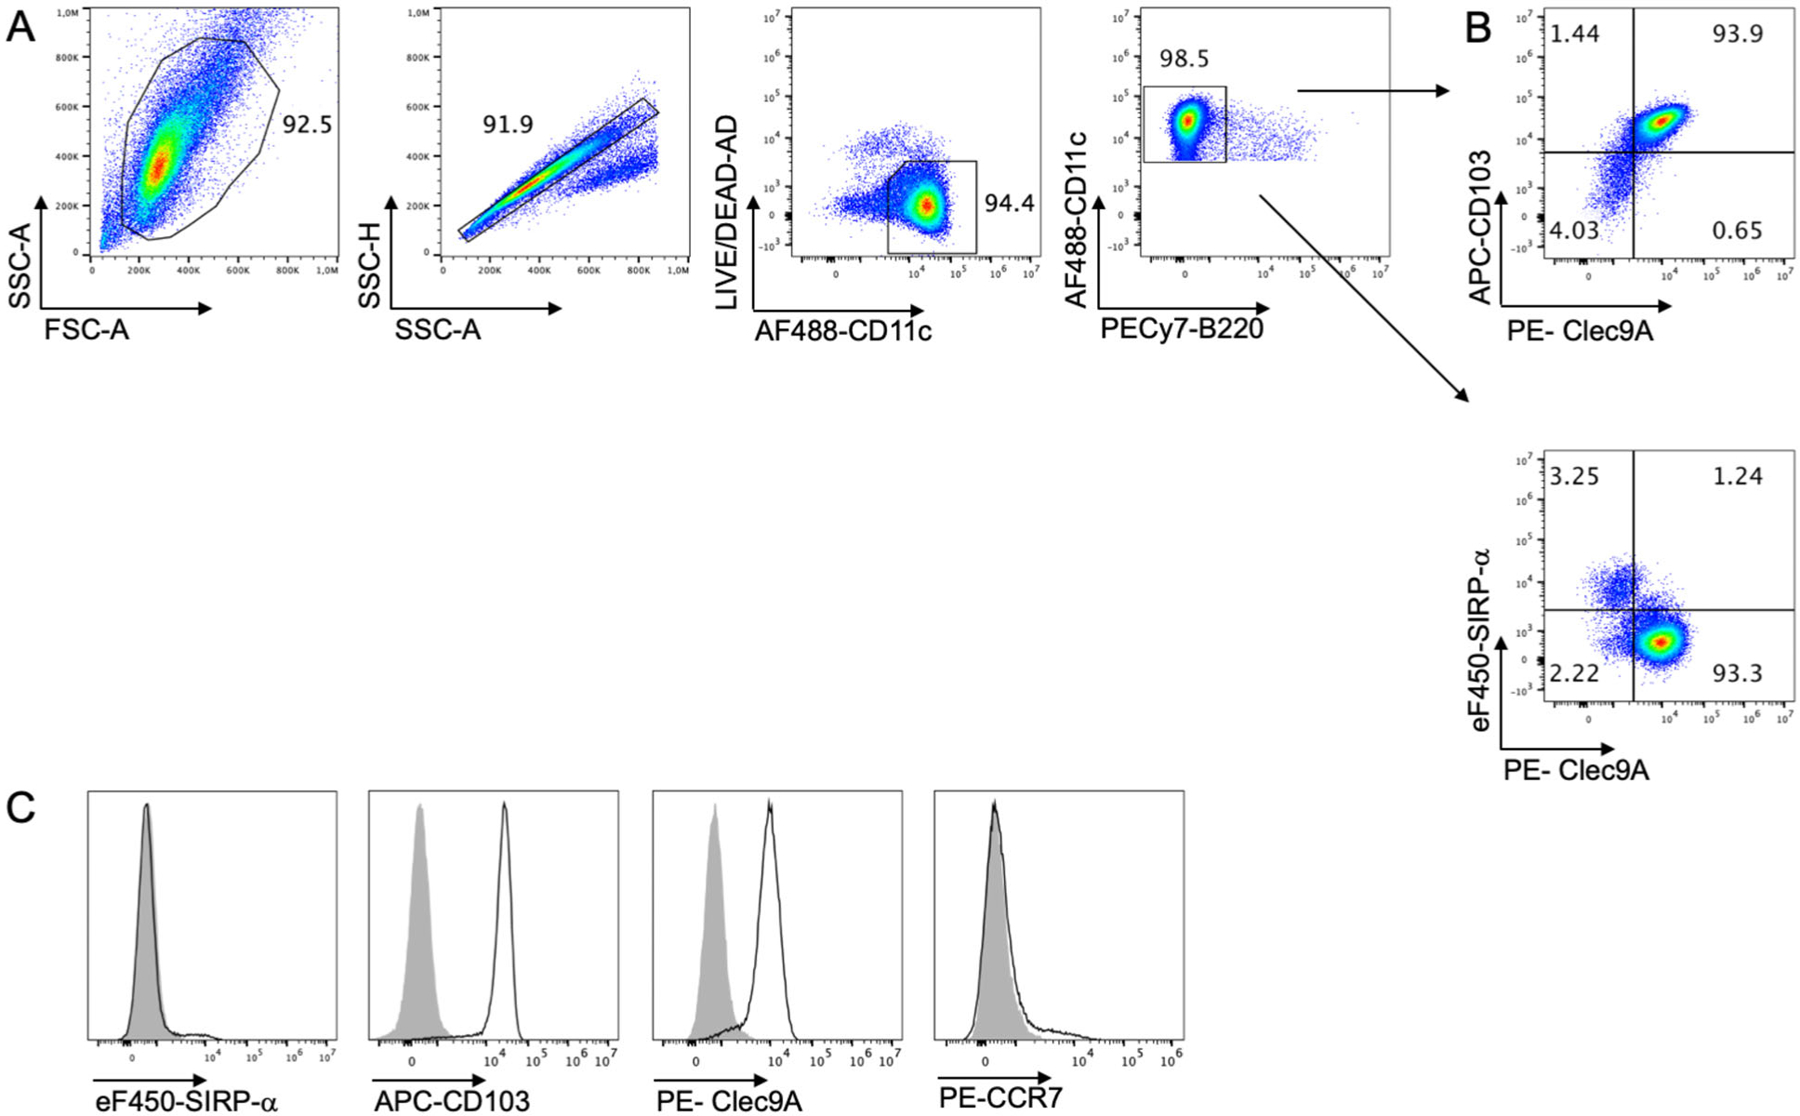
Figure 16.

Gating strategy for identification of iCD103-DC.
(A) Representative flow cytometry (FC) analysis of the gating strategy applied for the identification of iCD103-DC obtained on day 16. BM-DC were first gated based on forward and side scatter area (FSC-A and SSC-A) and doublets and debris were excluded by gating on area vs the height of SSC (SSC-A and SSC-H). Dead cells were excluded using fixable live-dead aqua dead cell dye. (B) Representative dot plots showing frequencies of Clec9A+CD103+ and Clec9A+SIRP-α− cells. Gates were performed on live CD11c+B220− iCD103-DC as shown in (A). (C) Representative histograms were obtained by FC of live CD11c+B220− cells. Histograms represent the expression levels of SIRP-α, CD103, Clec9A, and CCR7 on d16 (black lines) and the respective control staining (grey overlay). In this example, 2 different staining panels were used.
