Figure 21.

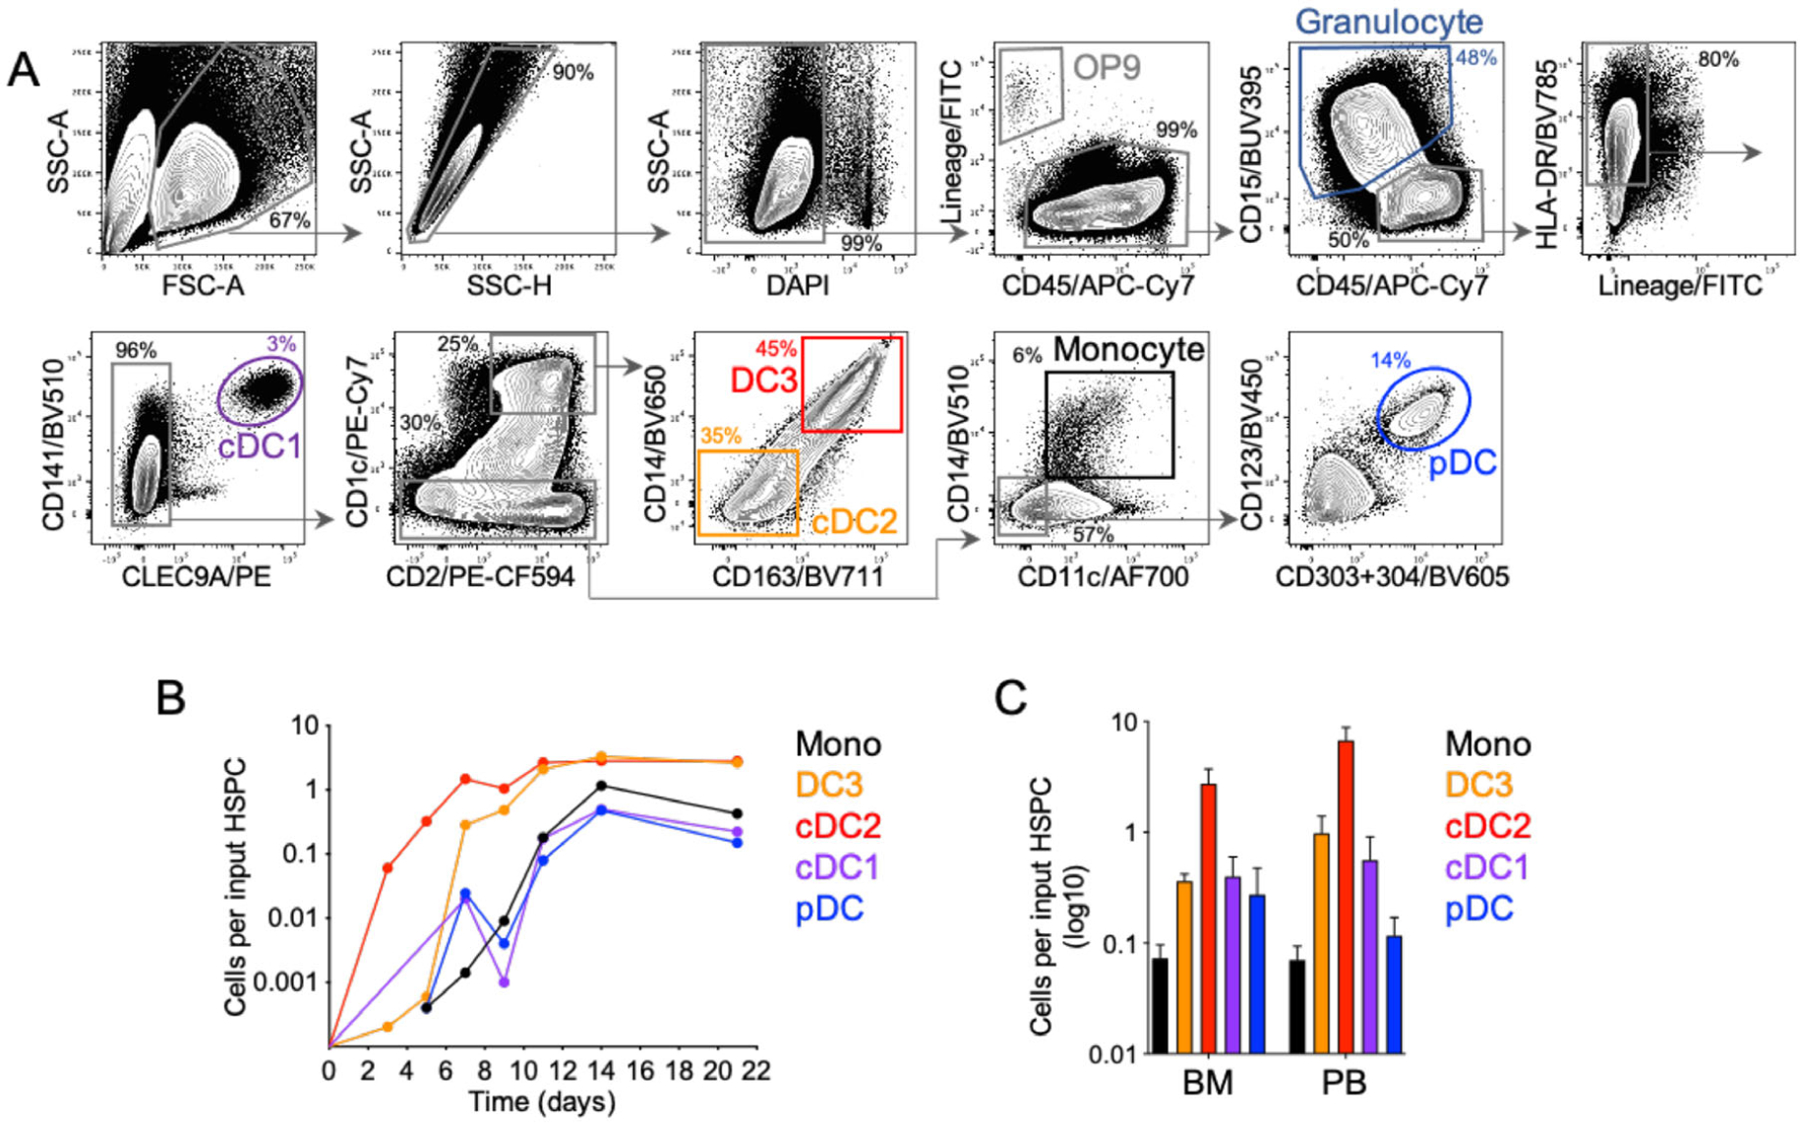
Flow cytometric analysis and DC output of CD34+ differentiation. (A) Flow cytometric analysis of the culture at Day 21, using LSR-Fortessa X20 (BD biosciences) and the panel described in Table 12. Debris, doublets, and dead cells are first excluded, followed by OP9 (GFP+ in the FITC channel and CD45−) and CD45lowCD15+ granulocyte precursors. Selecting lineage (CD3, 16, 19, 20, 34, 56) negative HLA-DR+ cells excludes lymphoid lineages and undifferentiated cells and selects antigen-presenting cells. DC subsets may then be identified by sequential gating: cDC1, CLEC9A+CD141+; cDC2, CD1c+CD2+(CD163−CD14−), DC3, CD1c+CD2+CD14+CD163+; Monocytes, CD11c+CD14+ (CD1c-CD2−); pDC, CD123+CD303/304+. Dimensionality reduction analyses (such as tSNE or UMAP) may also be used to visualize the discrete populations. (B) DC generation in culture at Days 3, 5, 7, 9, 11, 14, and 21, expressed as the number of subset-specific DC generated per CD34+ HSPC seeded at Day 0. Cells were identified phenotypically as shown in (A). (C) Number of DC generated from CD34+ HSPC isolated from BM or peripheral blood (PB), expressed as the number of subset-specific DC generated per CD34+ HSPC seeded at Day 0.
