
Figure 5.
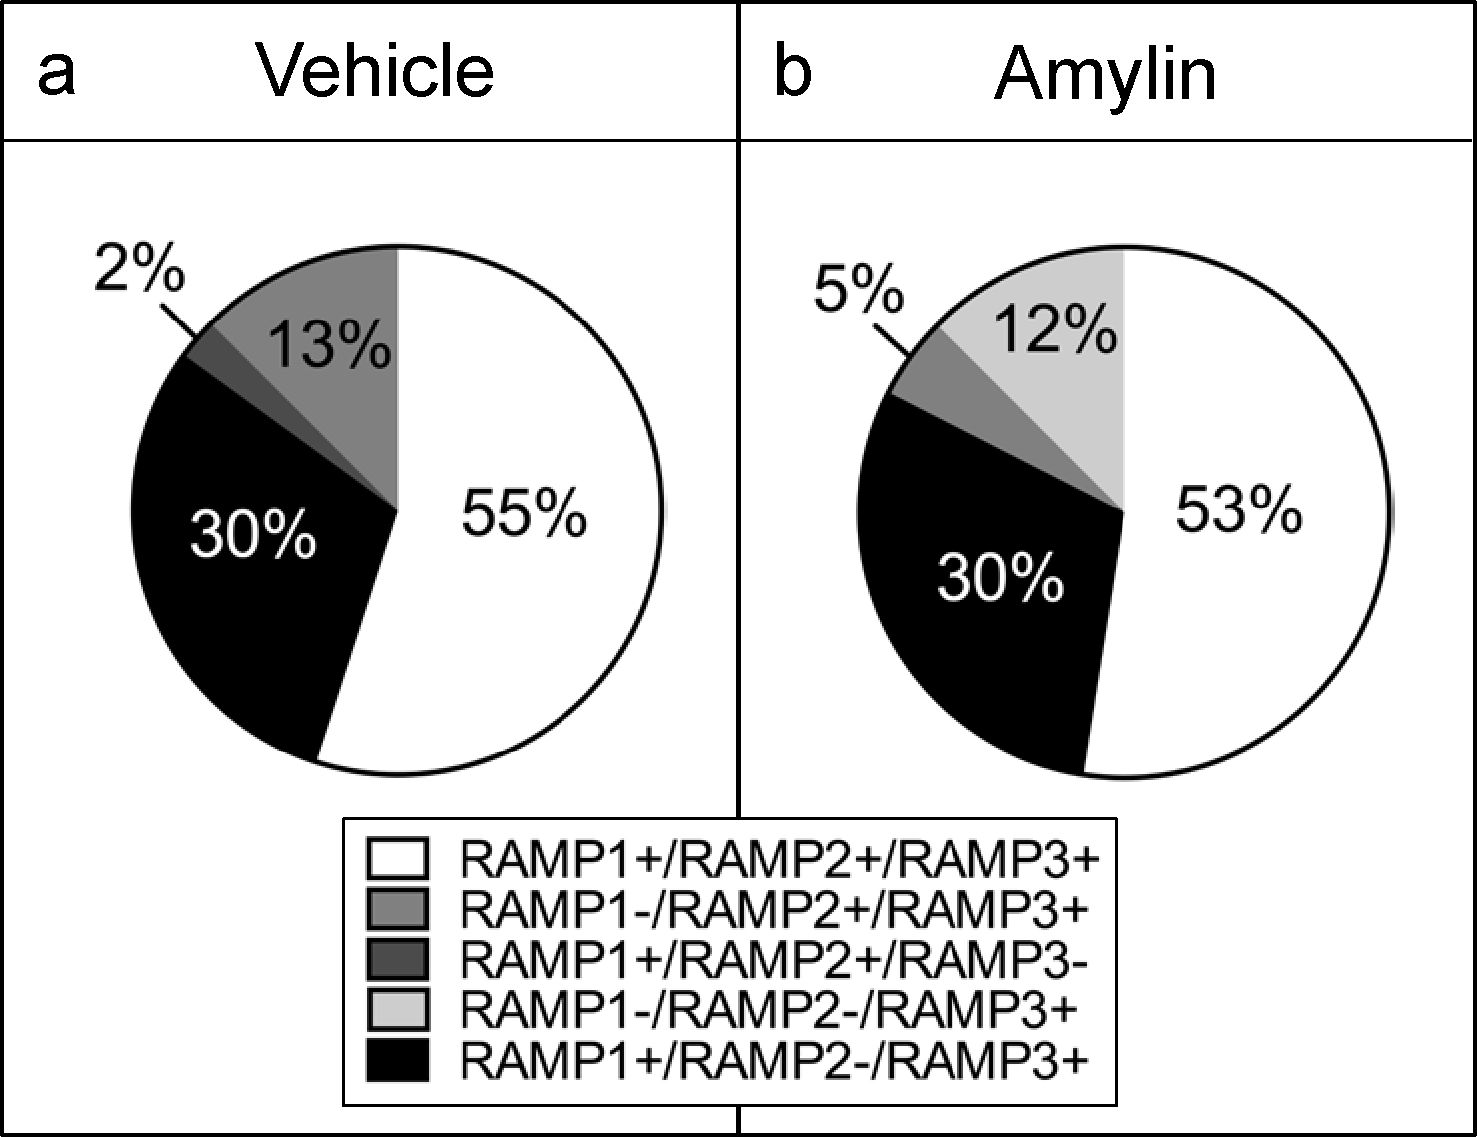
Distribution of RAMP2 mRNA respectively to the other RAMPs. All the selected cells were CTRa+. (a) In vehicle Fos-GFP females rats (n=4 per group), the collected AP single neurons (n=9–10 cells per rat), were mainly characterized as RAMP2+, being RAMP1+/RAMP2+/RAMP3+ (55%), RAMP1−/RAMP2+/RAMP3+ (13%) and RAMP1+/RAMP2+/RAMP3− (2%); 30% being RAMP1+/RAMP2−/RAMP3+). (b) RAMP2 mRNA distribution in amylin-treated animals was the following: RAMP1+/RAMP2+/RAMP3+ (53%), RAMP1−/RAMP2+/RAMP3+ (5%); RAMP1−/RAMP2−/RAMP3+ (12%) and RAMP1+/RAMP2−/RAMP3+ (30%).