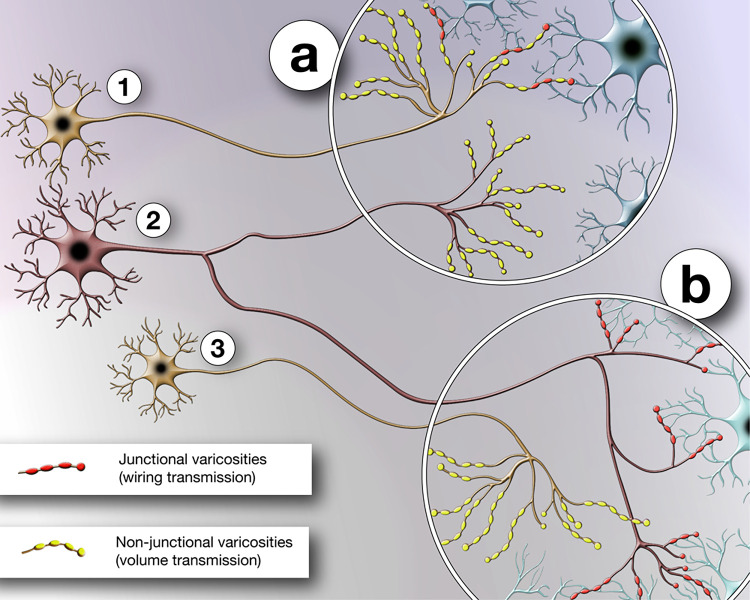
Figure 2.
Schematic representation of the hypothetical distribution of the two modalities of neurotransmission. In the scheme three serotonergic neurons are represented with neuron 1 projecting to target area (a) and displaying both wiring transmission and volume transmission, neuron 2 sending projections to target areas (a) and (b) where it displays volume transmission and wiring transmission modality, respectively, and neuron 3 projecting to target area (b) showing exclusively volume transmission.

