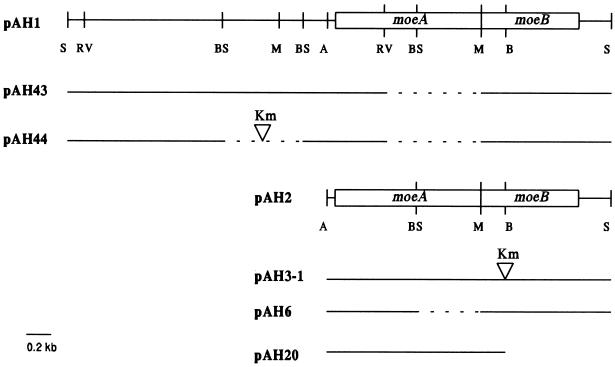
FIG. 1.
Restriction maps of the moe plasmids used in this study. Solid lines represent E. coli chromosomal DNA present in the plasmid; dashed lines indicate regions of chromosomal DNA that were deleted in the construction of the plasmid. Vector DNA is not presented. Each inverted triangle shows the position of insertion of a Kmr gene. A, AvaI; B, BstEII; BS, BssHII; M, MluI; RV, EcoRV; S, SphI.

